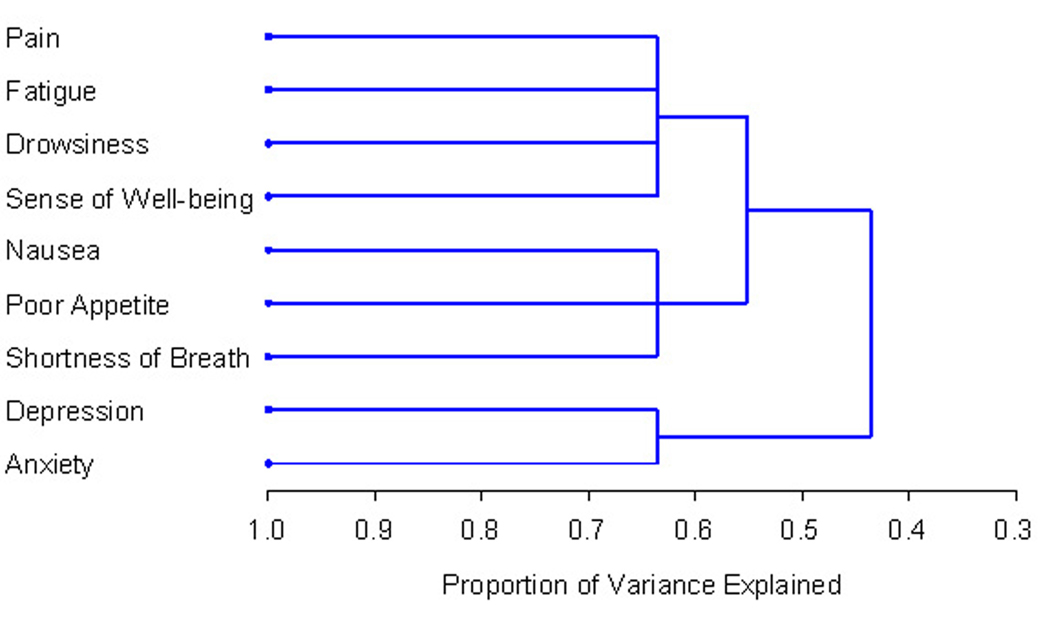
Figure 1. PROC TREE procedure generated dendrogram displaying three cluster solution and cluster hierarchy. More similar symptoms were joined together earlier.
| World Journal of Oncology, ISSN 1920-4531 print, 1920-454X online, Open Access |
| Article copyright, the authors; Journal compilation copyright, World J Oncol and Elmer Press Inc |
| Journal website http://www.wjon.org |
Original Article
Volume 3, Number 1, February 2012, pages 23-32
Symptom Clusters Using the Edmonton Symptom Assessment System in Patients With Bone Metastases: A Reanalysis Comparing Different Statistical Methods
Figure
Tables
| Characteristics | N (%) |
|---|---|
| SD: standard deviation. | |
| Age at radiation (year) | |
| Mean ± SD | 67.9 ± 10.9 |
| Median (range) | 68 (31 - 93) |
| Sex | |
| Male | 280 (54%) |
| Female | 238 (46%) |
| Weight loss ≥ 10% in the past 6 months | |
| No | 261 (50%) |
| Yes | 180 (35%) |
| Unknown | 77 (15%) |
| Karnofsky Performance Status | |
| Mean ± SD | 61.2 ± 14.1 |
| Median (range) | 60 (10 - 100) |
| Total Morphine Equivalent | |
| Mean ± SD | 103 ± 234 |
| Median (range) | 30 (0 - 3600) |
| Primary cancer sites | |
| Breast | 127 (25%) |
| Prostate | 117 (23%) |
| Lung | 130 (25%) |
| GI | 39 (8%) |
| Unknown | 34 (7%) |
| Others | 71 (14%) |
| R2 | ||||
|---|---|---|---|---|
| Own Cluster | Next Cluster | 1 – R2own cluster | ||
| 1 – R2own cluster | ||||
| HCA: Hierarchical Component Analysis; First Cluster explained 47%, second Cluster explained 84% of the total variation. The Cluster 1 will be split due to the smallest proportion of variation (47%). | ||||
| Cluster 1 | Pain | 0.3863 | 0.0663 | 0.6573 |
| Fatigue | 0.5332 | 0.1531 | 0.5512 | |
| Nausea | 0.4157 | 0.1303 | 0.6719 | |
| Drowsiness | 0.5374 | 0.1420 | 0.5392 | |
| Poor Appetite | 0.5290 | 0.1088 | 0.5285 | |
| Sense of Well-being | 0.5762 | 0.2457 | 0.5618 | |
| Shortness of Breath | 0.3387 | 0.0558 | 0.7004 | |
| Cluster 2 | Depression | 0.8383 | 0.2745 | 0.2228 |
| Anxiety | 0.8383 | 0.1686 | 0.1944 | |
| R2 | ||||
|---|---|---|---|---|
| Own Cluster | Next Cluster | 1 – R2own cluster | ||
| 1 – R2own cluster | ||||
| HCA: Hierarchical Component Analysis. One Cluster 1 explained 44%, two Clusters explained 55%, and three Clusters explained 64% of the total variation | ||||
| Cluster 1 | Pain | 0.4842 | 0.1412 | 0.6006 |
| Fatigue | 0.6378 | 0.2182 | 0.4633 | |
| Drowsiness | 0.6305 | 0.2299 | 0.4798 | |
| Sense of Well-being | 0.6007 | 0.3140 | 0.5820 | |
| Cluster 2 | Depression | 0.8383 | 0.2525 | 0.2163 |
| Anxiety | 0.8383 | 0.1655 | 0.1937 | |
| Cluster 3 | Nausea | 0.5776 | 0.2012 | 0.5288 |
| Poor Appetite | 0.6176 | 0.3123 | 0.5561 | |
| Shortness of Breath | 0.5129 | 0.1464 | 0.5706 | |
| Component | Eigenvalue | Proportion | Cumulative |
|---|---|---|---|
| BPI: Brief Pain Inventory; EFA: Exploratory Factor Analysis. From eigenvalues and proportions of variance, two factors (clusters) were retained (eigenvalue > 1.0 and proportion > 10%), and the cumulative variance showed up to 100%. | |||
| 1 | 10.7297 | 0.8254 | 0.8254 |
| 2 | 2.2704 | 0.1746 | 1.0000 |
| 3 | 0.4049 | 0.0311 | 1.0311 |
| 4 | 0.0902 | 0.0069 | 1.0381 |
| 5 | 0.0228 | 0.0018 | 1.0398 |
| 6 | 0.0027 | 0.0002 | 1.0400 |
| 7 | -0.0714 | -0.0055 | 1.0346 |
| 8 | -0.1698 | -0.0131 | 1.0215 |
| 9 | -0.2794 | -0.0215 | 1.0000 |
| Factor 1 | Factor 2 | Final communality | |
|---|---|---|---|
| EFA: Exploratory Factor Analysis. | |||
| Drowsiness | 0.67 | 0.20 | 0.49 |
| Fatigue | 0.66 | 0.23 | 0.49 |
| Sense of Well-being | 0.65 | 0.36 | 0.55 |
| Poor Appetite | 0.63 | 0.20 | 0.44 |
| Pain | 0.51 | 0.14 | 0.28 |
| Nausea | 0.49 | 0.26 | 0.31 |
| Dyspnea | 0.44 | 0.13 | 0.21 |
| Depression | 0.29 | 0.89 | 0.87 |
| Anxiety | 0.23 | 0.69 | 0.53 |
| % of variance | 82.5% | 17.5% | |
| Cronbach’s alpha | 0.82 | 0.81 | |
| Symptom | Baseline (n = 518) | 1 week FU (n = 272) | 2 week FU (n = 297) | 4 week FU (n = 266) | 8 week FU (n = 231) | 12 week FU (n = 193) | ||||||||||||
|---|---|---|---|---|---|---|---|---|---|---|---|---|---|---|---|---|---|---|
| PCA | EFA | HCA | PCA | EFA | HCA | PCA | EFA | HCA | PCA | EFA | HCA | PCA | EFA | HCA | PCA | EFA | HCA | |
| FU: follow-up; PCA: Principal Component Analysis; EFA: Exploratory Factor Analysis; HCA: Hierarchical Component Analysis. Symptoms with corresponding symbols indicate they were in the same cluster. Dash indicates the symptom was not present in any clusters. | ||||||||||||||||||
| Depression | Δ | Δ | Δ | Δ | Δ | Δ | Δ | Δ | Δ | Δ | Δ | Δ | Δ | — | Δ | Δ | Δ | Δ |
| Anxiety | Δ | Δ | Δ | Δ | Δ | Δ | Δ | Δ | Δ | Δ | Δ | Δ | Δ | — | Δ | Δ | Δ | Δ |
| Fatigue | Ο | Ο | Ο | Ο | Ο | Ο | O | Ο | Ο | Ο | Ο | Ο | Δ | — | Ο | Ο | Ο | Ο |
| Drowsiness | Ο | Ο | Ο | Ο | Ο | Ο | O | Ο | Ο | Ο | Ο | Ο | Ο | — | Ο | Ο | Ο | Ο |
| Pain | O | Ο | O | X | Ο | X | O | Ο | Ο | Δ | Ο | O | Δ | — | Δ | Ο | Ο | Ο |
| Nausea | X | Ο | X | X | Δ | X | Δ | Δ | Δ | Ο | Ο | Ο | Ο | — | Ο | X | Ο | X |
| Poor appetite | X | Ο | X | X | Ο | X | Δ | Ο | Δ | Ο | Ο | Ο | Δ | — | Δ | Δ | Ο | Δ |
| Dyspnea | X | Ο | X | O | Ο | Ο | — | Ο | — | — | Δ | — | — | — | — | X | Ο | X |
| Poor well-being | O | Ο | O | Δ | Δ | Δ | Δ | Δ | Δ | Δ | Δ | Δ | Δ | — | Δ | Δ | Δ | Δ |
| Method | Symptom | Baseline | 1 week FU | 2 week FU | 4 week FU | 8 week FU | 12 week FU | ||||||
|---|---|---|---|---|---|---|---|---|---|---|---|---|---|
| NR n = 518 | R n = 518 | NR n = 140 | R n = 132 | NR n = 148 | R n = 149 | NR n = 132 | R n = 134 | NR n = 122 | R n = 109 | NR n = 95 | R n = 98 | ||
| PCA: Principal Component Analysis; FU: follow-up; NR: non-responders; R: responders. Symptoms with corresponding symbols indicate they were in the same cluster. | |||||||||||||
| Dash indicates the symptom was not present in any clusters. | |||||||||||||
| Depression | Δ | Δ | Δ | Δ | Δ | Δ | Δ | Δ | Δ | Δ | Δ | Δ | |
| Anxiety | Δ | Δ | Δ | Δ | Δ | Δ | Δ | Δ | Δ | Δ | Δ | Δ | |
| Fatigue | X | X | Ο | Ο | Ο | Δ | Ο | O | Ο | Δ | Ο | Δ | |
| Drowsiness | X | X | Ο | Ο | Ο | Δ | Ο | O | Ο | Δ | Ο | Δ | |
| PCA | Pain | X | X | X | X | X | Δ | Δ | X | Δ | — | Ο | — |
| Nausea | O | O | X | X | Δ | O | Ο | X | Ο | O | X | Δ | |
| Poor appetite | O | O | X | Ο | Δ | O | X | O | Δ | O | O | O | |
| Dyspnea | Ο | Ο | Ο | Ο | X | — | X | O | — | O | X | O | |
| Poor well-being | X | X | Δ | Δ | Δ | O | Δ | Δ | Δ | Δ | Δ | Δ | |
| Method | Symptom | Baseline | 1 week FU | 2 week FU | 4 week FU | 8 week FU | 12 week FU | |||||||
|---|---|---|---|---|---|---|---|---|---|---|---|---|---|---|
| NR n = 518 | R n = 518 | NR n = 140 | R n = 132 | NR n = 148 | R n = 149 | NR n = 132 | R n = 134 | NR n = 122 | R n = 109 | NR n = 95 | R n = 98 | |||
| EFA: Exploratory Factor Analysis; FU: follow-up; NR: non-responders; R: responders. Symptoms with corresponding symbols indicate they were in the same cluster. Dash indicates the symptom was not present in any clusters. | ||||||||||||||
| Depression | Δ | Δ | Δ | Δ | Δ | Δ | Δ | Δ | Δ | — | Δ | Δ | ||
| Anxiety | Δ | Δ | Δ | Δ | Δ | Δ | Δ | Δ | Δ | — | Δ | Δ | ||
| Fatigue | Ο | Ο | Ο | Ο | Ο | Ο | Ο | Ο | Ο | — | Ο | Δ | ||
| Drowsiness | Ο | Ο | Ο | Ο | Ο | Ο | Ο | Ο | Ο | — | Ο | O | ||
| EFA | Pain | Ο | Ο | X | Δ | Δ | Δ | O | Δ | Δ | — | Ο | Δ | |
| Nausea | Ο | Ο | X | Δ | Δ | Ο | O | Δ | Ο | — | Ο | O | ||
| Poor appetite | Ο | Ο | X | Ο | Δ | Ο | Δ | O | Δ | — | Ο | Δ | ||
| Dyspnea | Ο | Ο | Ο | Ο | Ο | Δ | Δ | Ο | O | — | Ο | Δ | ||
| Poor well-being | Ο | Ο | Δ | Δ | Δ | Ο | Δ | Δ | Δ | — | — | Δ | ||
| Method | Symptom | Baseline | 1 week FU | 2 week FU | 4 week FU | 8 week FU | 12 week FU | |||||||
|---|---|---|---|---|---|---|---|---|---|---|---|---|---|---|
| NR n = 518 | R n = 518 | NR n = 140 | R n = 132 | NR n = 148 | R n = 149 | NR n = 132 | R n = 134 | NR n = 122 | R n = 109 | NR n = 95 | R n = 98 | |||
| HCA: Hierarchical Component Analysis; FU: follow-up; NR: non-responders; R: responders. Symptoms with corresponding symbols indicate they were in the same cluster. Dash indicates the symptom was not present in any clusters. | ||||||||||||||
| Depression | Δ | Δ | Δ | Δ | Δ | Δ | Δ | Δ | Δ | Δ | Δ | Δ | ||
| Anxiety | Δ | Δ | Δ | Δ | Δ | Δ | Δ | Δ | Δ | Δ | Δ | Δ | ||
| Fatigue | X | X | Ο | Ο | Ο | Δ | Ο | Ο | Δ | Δ | Ο | Δ | ||
| Drowsiness | X | X | Ο | Ο | Ο | Δ | Ο | Ο | Δ | Δ | Ο | Ο | ||
| HCA | Pain | X | X | X | X | X | Δ | Δ | X | O | — | Ο | X | |
| Nausea | O | O | X | X | Δ | X | Ο | X | Δ | O | X | O | ||
| Poor appetite | O | O | X | O | — | X | Δ | Ο | O | Δ | O | Ο | ||
| Dyspnea | Ο | Ο | Ο | Ο | X | — | — | O | — | O | X | X | ||
| Poor well-being | X | X | Δ | Δ | Δ | X | Δ | Δ | O | Δ | Δ | Δ | ||