Figures
![Figure 1.](/tables/wjon449w-g001.jpg)
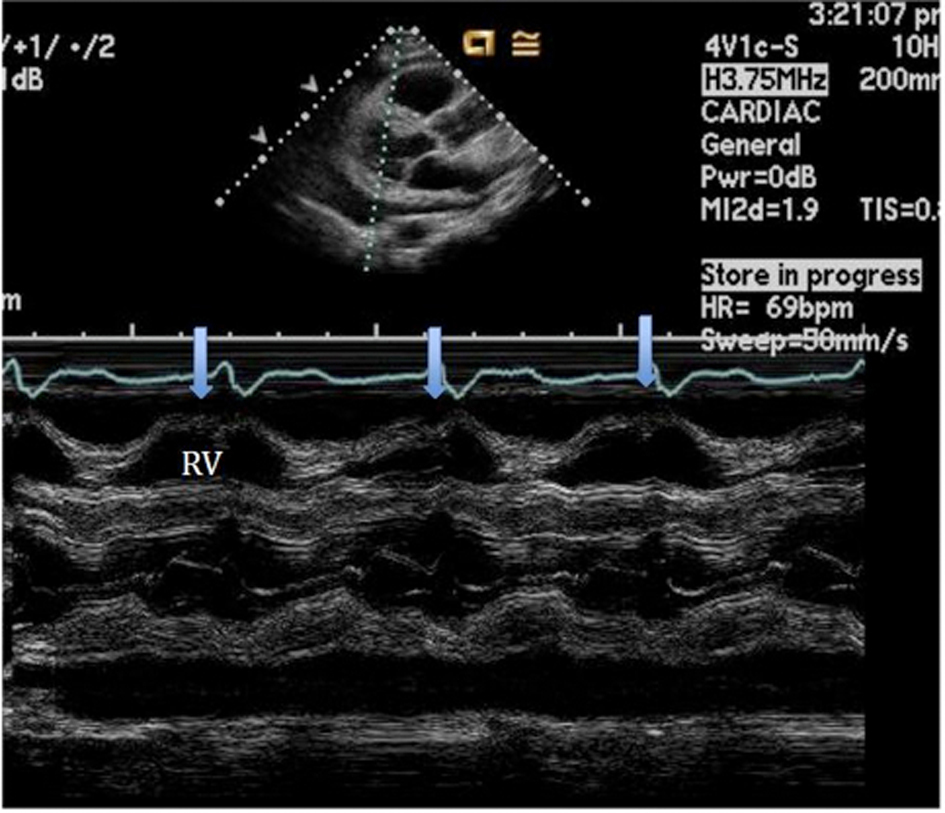
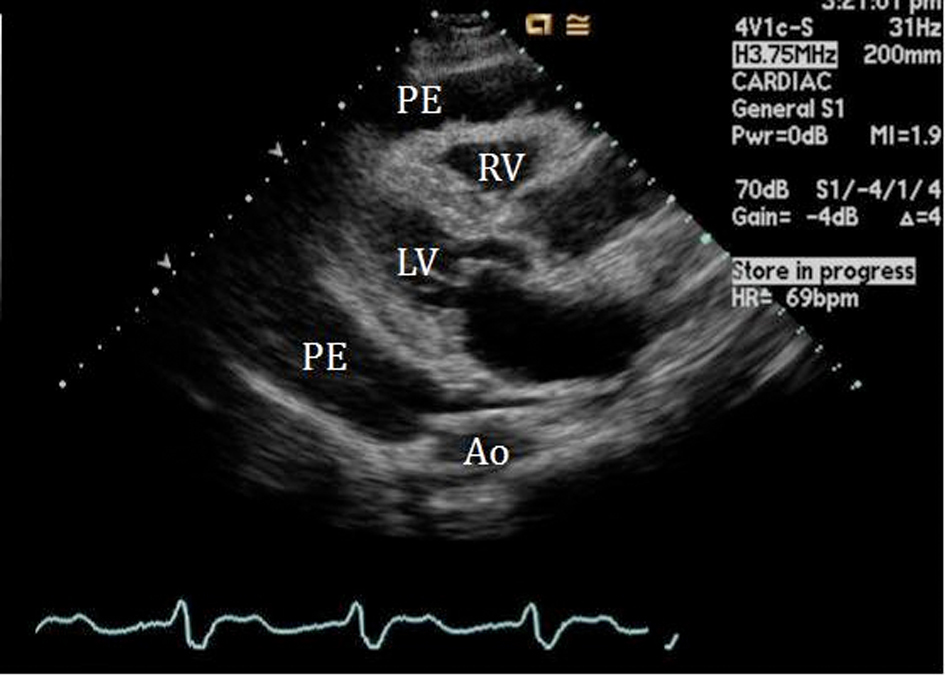
Figure 1. 2-D Parasternal long axis view showing large pericardial effusion (PE) surrounding the right (RV) and left ventricle (LV).
![Figure 2.](/tables/wjon449w-g002.jpg)
Figure 2. M-mode of the parasternal long axis view establishing the diagnosis of cardiac tamponade showing the collapse of the RV during diastole.
![Figure 3.](/tables/wjon449w-g003.jpg)
Figure 3. RA pressure before pericardiocentesis: high RA mean pressure at 38 mmHg, X and Y descents are similar. Changes in the baseline reflect patient’s tachypnea.Δ and *represent X and Y descent respectively.
![Figure 4.](/tables/wjon449w-g004.jpg)
Figure 4. Echocardiogram performed after the pericardiocentesis showed resolution of the effusion, instead pleural effusion (PLE) becomes more evident as an echolucent space below the aorta (Ao).
![Figure 5.](/tables/wjon449w-g005.jpg)
Figure 5. RA pressure after pericardiocentesis: mean RA pressure remains high at 33 mmHg with change in the wave pattern, deep Y descents (*).