World Journal of Oncology, ISSN 1920-4531 print, 1920-454X online, Open Access
Article copyright, the authors; Journal compilation copyright, World J Oncol and Elmer Press Inc
Journal website http://www.wjon.org

Original Article

Volume 3, Number 3, June 2012, pages 97-102


Lung Cancer Screening for the Poor and Underserved: Should Routine Screening be Performed?

Figure

Figure 1.
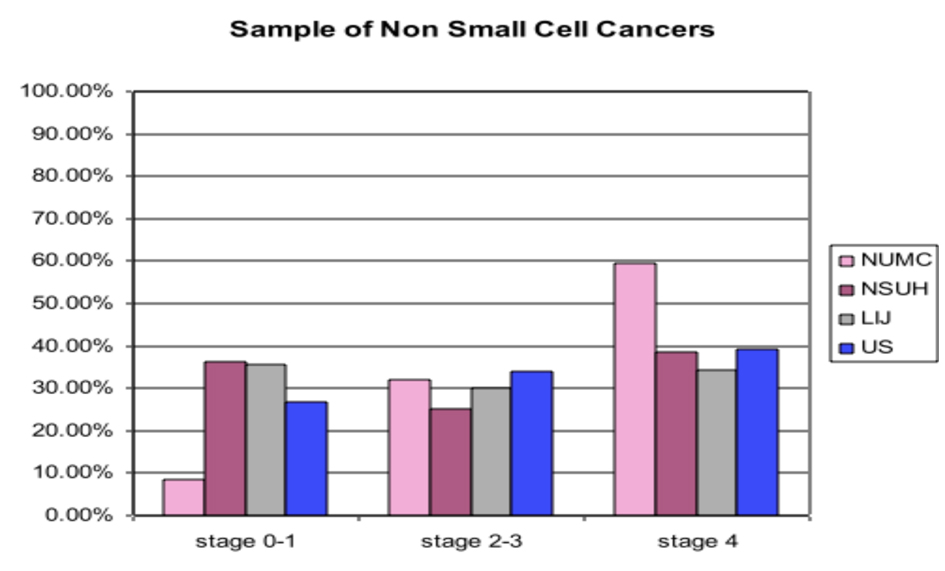
Figure 1. Sample of Non Small Cell Cancers. Vertical axis: percentage of total patients diagnosed in various stages; Horizontal axis: Stage of Lung Cancer; NUMC: Nassau University Medical Center; NSUH: North Shore University Hospital; LIJ: Long Isiand Jewish Hospital; US: United States.

Tables

Table 1. Sample of Non-Small Cell Cancers
 
VariableNUMC % (#)NSUH % (#)LIJ % (#)US % (#)P-value
NUMC vs. NSUH
P-value
NUMC vs. LIJ
P-value
NUMC vs. US
NUMC: Nassau University Medical Center; NSUH: North Shore University Hospital; LIJ: Long Island Jewish; US: United States.
Stage 0-18.55% (30)36.18% (246)35.70% (136)26.69% (26,217)< 0.001< 0.001< 0.001
Stage 2-331.91% (112)25.29% (172)29.92% (114)34.03% (33,421)
Stage 459.54% (209)38.53% (262)34.38% (131)39.28% (38,579)
Stage 0-18.55% (30)36.18% (246)35.70% (136)26.69% (26,217)< 0.001< 0.001< 0.001
Stage 2-491.45% (321)63.82% (434)64.30% (245)73.31% (72,000)
Stage 0-112.55% (30)48.43% (246)50.94% (136)40.46% (26,217)< 0.001< 0.001< 0.001
Stage 487.45% (209)51.57% (262)49.06% (131)59.54% (38,579)


Table 2. Sample of Those With Adenocarcinoma
 
VariableNUMC % (#)NSUH % (#)LIJ % (#)P-value
NUMC vs. NSUH
P-value
NUMC vs. LIJ
NUMC: Nassau University Medical Center; NSUH: North Shore University Hospital; LIJ: Long Island Jewish; US: United States.
Stage 0-19.90% (10)45.24% (176)40.96% (77)< 0.001< 0.001
Stage 2-324.75% (25)20.57% (80)28.19% (53)
Stage 465.35% (66)34.19% (133)30.85% (58)
Stage 0-19.90% (10)45.24% (176)40.96% (77)< 0.001< 0.001
Stage 2-490.10% (91)54.76% (213)59.04% (111)
Stage 0-113.16% (10)56.96% (176)57.04% (77)< 0.001< 0.001
Stage 486.84% (66)43.04% (133)42.96% (58)


Table 3. Sample of Those With Squamous Cell Carcinoma
 
VariableNUMC % (#)NSUH % (#)LIJ % (#)P-value
NUMC vs. NSR
P-value
NUMC vs. LIJ
NUMC: Nassau University Medical Center; NSUH: North Shore University Hospital; LIJ: Long Island Jewish; US: United States. Note: Fisher’s exact test analyses used due to small sample size for NUMC.
Stage 0-17.14% (4)37.88% (50)39.33% (35)< 0.001< 0.001
Stage 2-341.07% (23)36.36% (48)32.58% (29)
Stage 451.79% (29)25.76% (34)28.09% (25)
Stage 0-17.14% (4)37.88% (50)39.33% (35)< 0.001< 0.001
Stage 2-492.86% (52)62.12% (82)60.67% (54)
Stage 0-112.12% (4)59.52% (50)58.33% (35)< 0.001< 0.001
Stage 487.88% (29)40.48% (34)41.67% (25)