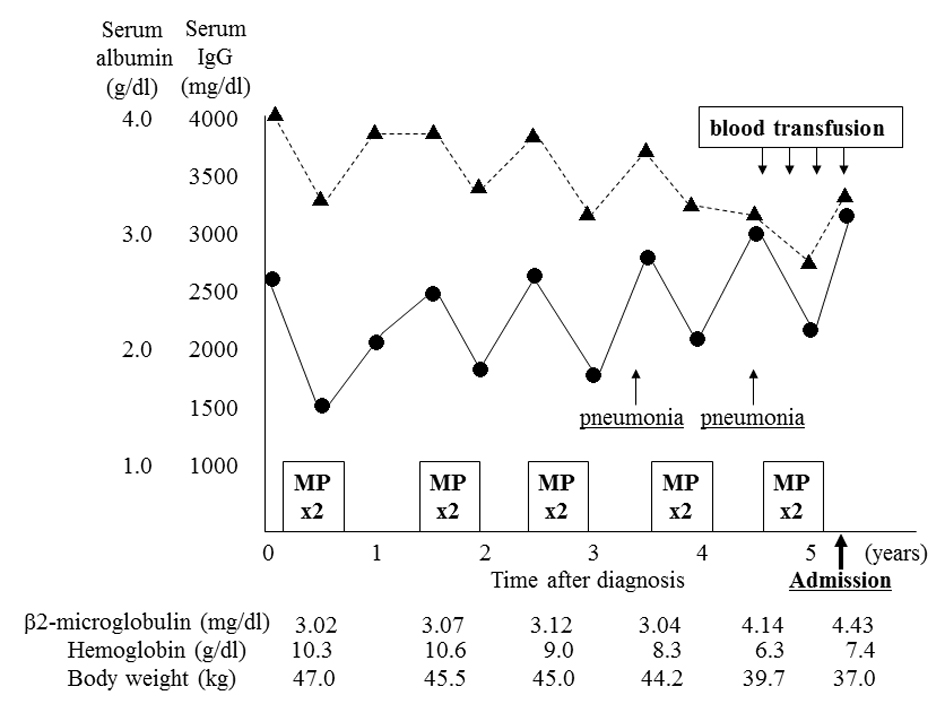
Figure 1. Clinical course before admission. The patient underwent five courses (two cycles each) of combination therapy with melphalan and prednisolone (MP) before admission. Although chemotherapy had been effective, serum albumin level (Alb, ▲) and hemoglobin level gradually decreased, and IgG level (•) and β2-microglobulin level increased. She was admitted twice for the treatment of bacterial pneumonia. She underwent a conspicuous weight loss during the year before admission, accompanied by a need for frequent blood transfusion.
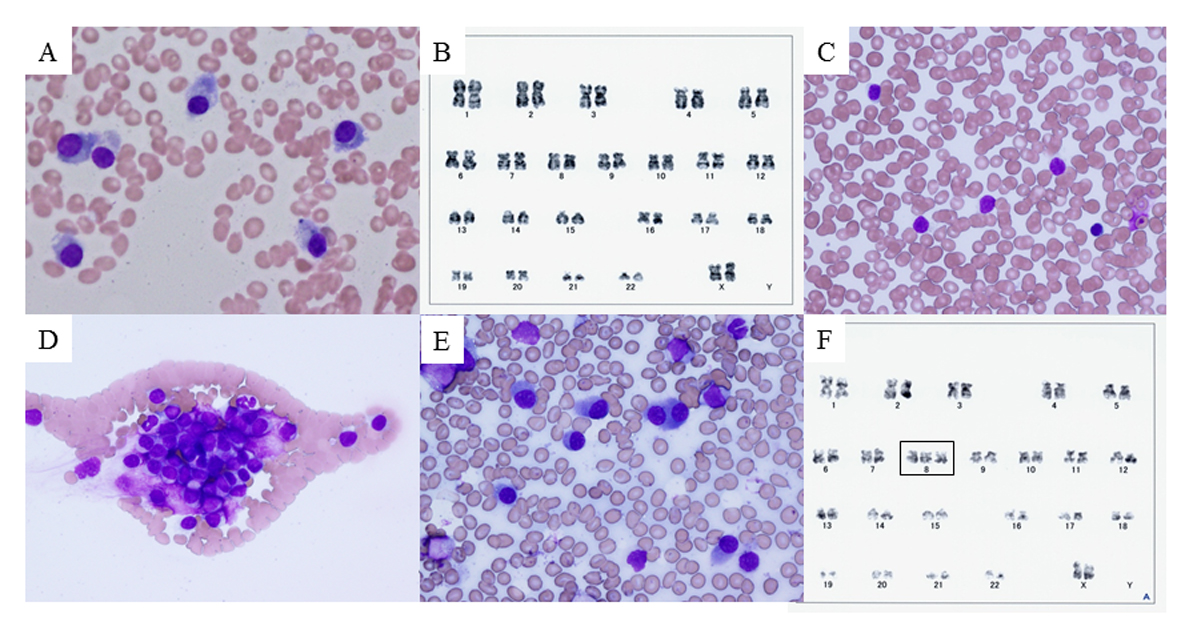
Figure 2. Bone marrow smear, peripheral blood smear, and chromosome analysis. (A) Bone marrow smear with Giemsa staining on day 3, showing plasma cells (myeloma cells) with basophilic cytoplasm and perinuclear halos. (B) Chromosome analysis of bone marrow cells on day 3, showing normal karyotype. (C, D) Peripheral blood smear with Giemsa staining on day 28, showing unclassifiable lymphoid cells with scant cytoplasm and cytoplasmic hairy projections. These cells tended to form conglomerates. (E) Bone marrow smear with Giemsa staining on day 28. Myeloma cells predominated (58.5%) and only a few lymphoid cells were observed (2.5%). (F) Chromosome analysis of peripheral blood on day 30, showing trisomy of chromosome 8 that had not previously been observed (rectangle).
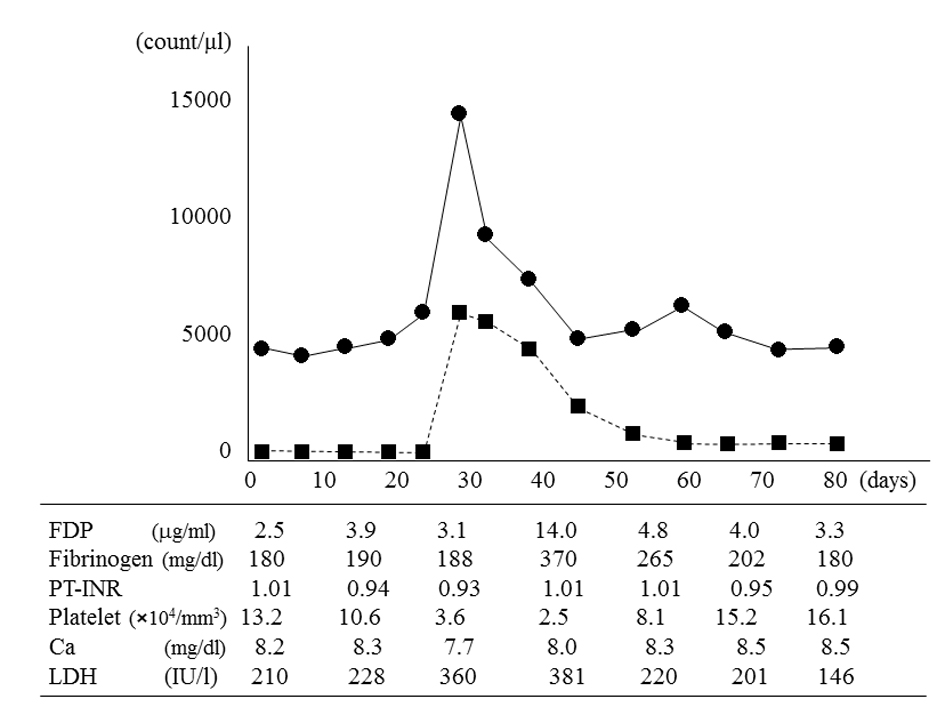
Figure 3. White blood cell count, atypical plasma cell count in peripheral blood, and other laboratory parameters. The white blood cell count (•) and atypical plasma cell count (■) peaked on day 28 and then spontaneously decreased. On day 42, fibrin degradation products (FDP), fibrinogen, and lactate dehydrogenase (LDH) values peaked; and the platelet count reached its minimum value. The atypical plasma cell count in peripheral blood decreased to 20/mm3 on day 58, but did not completely resolve. The calcium (Ca) level and prothrombin time-international normalized ratio (PT-INR) remained almost normal.