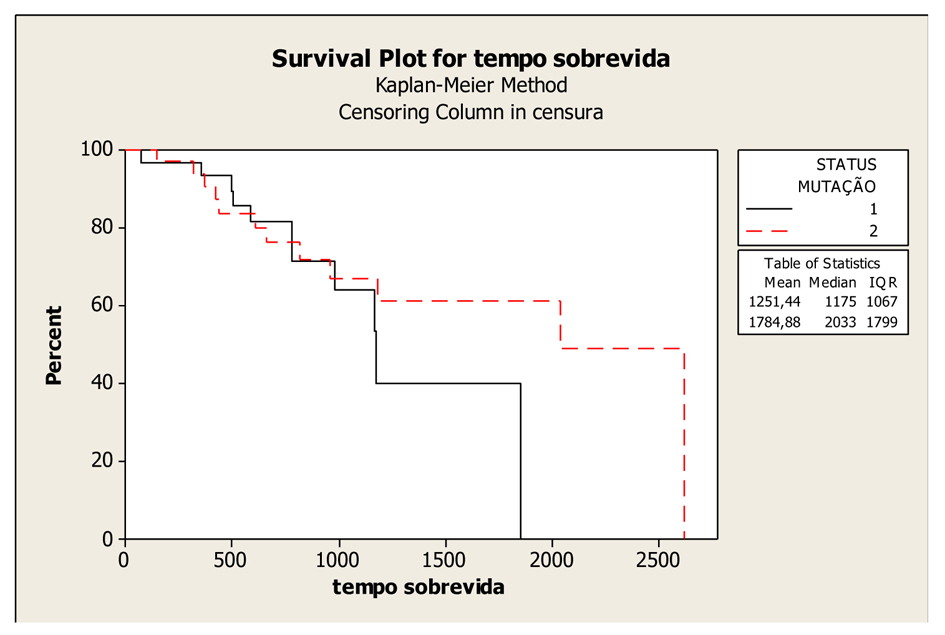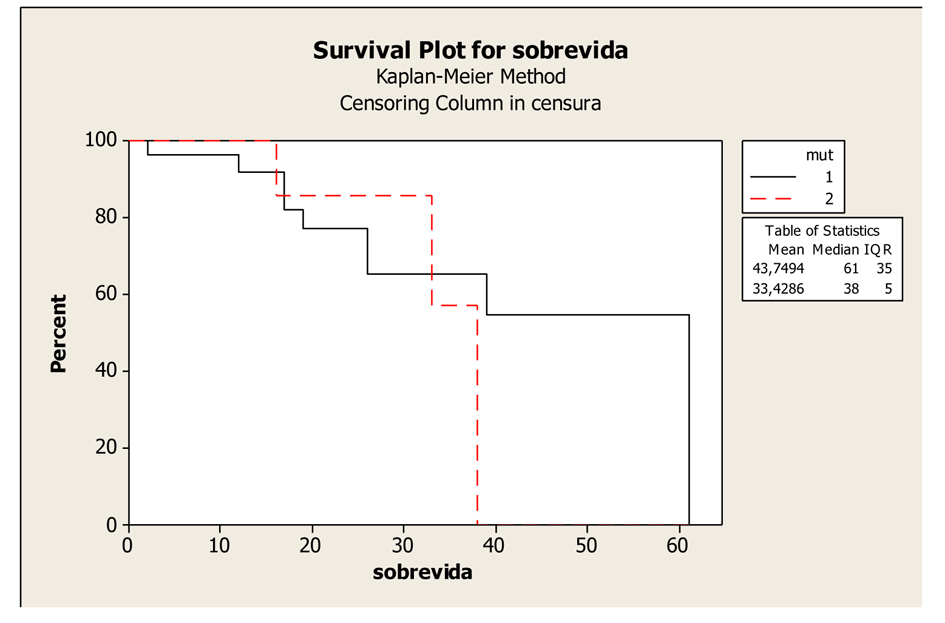
Figure 1. Kaplan-Meier Overall Survival Curves according to KRAS gene status (mutated and wild-type), P-value = 0.407. Legend: K-RAS mutated: 1; K-RAS wild-type: 2.
| World Journal of Oncology, ISSN 1920-4531 print, 1920-454X online, Open Access |
| Article copyright, the authors; Journal compilation copyright, World J Oncol and Elmer Press Inc |
| Journal website http://www.wjon.org |
Original Article
Volume 4, Number 4-5, October 2013, pages 179-187
Clinical-Pathological Correlation of KRAS Mutation Status in Metastatic Colorectal Adenocarcinoma
Figures


Tables
| Clinical-pathological features | Total (n = 65) | K-RAS wild-type (n = 33) | K-RAS mutated (n = 32) | P-value |
|---|---|---|---|---|
| ECOG: Eastern Cooperative Oncology Group; LNR: lymph node ratio. | ||||
| Gender | 0.195 | |||
| Male | 28 | 12 | 16 | |
| Female | 37 | 21 | 16 | |
| Age | 0.046 | |||
| > 65 years | 44 | 30 | 14 | |
| < 65 years | 21 | 3 | 18 | |
| ECOG | 0.495 | |||
| 0 | 38 | 17 | 21 | |
| 1 | 25 | 15 | 10 | |
| 2 | 2 | 1 | 1 | |
| Histological type | 0.256 | |||
| Adenocarcinoma | 50 | 27 | 23 | |
| Mucinous | 15 | 6 | 9 | |
| Cell differentiation | 0.221 | |||
| well | 49 | 27 | 22 | |
| intermediate | 16 | 6 | 10 | |
| LNR > 0.16 | (60) | 0.371 | ||
| Yes | 34 | 17 | 17 | |
| No | 26 | 11 | 15 | |
| Lung metastasis | 0.531 | |||
| Yes | 34 | 16 | 18 | |
| No | 31 | 17 | 14 | |
| Liver metastasis | 0.663 | |||
| Yes | 43 | 21 | 22 | |
| No | 22 | 12 | 10 | |
| Synchronous metastasis | 0.051 | |||
| Yes | 35 | 14 | 21 | |
| No | 30 | 19 | 11 | |
| Primary tumor site | 0.914 | |||
| Colon | 28 | 14 | 14 | |
| Rectum | 37 | 19 | 18 | |
| Obstructive and/or perforated acute abdomen | 0.273 | |||
| Yes | 11 | 7 | 4 | |
| No | 54 | 26 | 28 | |
| Staging | 0.074 | |||
| II | 13 | 10 | 3 | |
| III | 17 | 9 | 8 | |
| IV | 35 | 14 | 21 | |
| Recurrence | 0.067 | |||
| Yes | 56 | 31 | 25 | |
| No | 9 | 2 | 7 | |
| Codon | Missense mutation | Amino acid Wild-type | Amino acid mutated | n = 32 (%) |
|---|---|---|---|---|
| n: number of patients; G: nucleotide glycine; A: nucleotide alanine; T: nucleotide thymine; C: nucleotide cytosine; Gly: nucleotide glycine; Asp: nucleotide aspartate; Val: nucleotide valine; Ala: nucleotide alanine; Ser: nucleotide serine; Cys: nucleotide cisteine. | ||||
| 12 (n = 24) | G-A | GGT (Gly) | GAT (Asp) | 11 (34.37%) |
| G-T | GGT (Gly) | GTT (Val) | 6 (18.75%) | |
| G-T | GGT (Gly) | TGT (Cys) | 4 (12.5%) | |
| G-A | GGT (Gly) | AGT (Ser) | 2 (6.25%) | |
| G-C | GGT (Gly) | GCT (Ala) | 1 (3.125%) | |
| 13 (n = 8) | G-A | GGC (Gly) | GAC (Asp) | 7 (21.87%) |
| G-T | GGC (Gly) | GTT (Val) | 1 (3.125%) | |
| Kras wild-type | Kras mutated | P-value | ||
|---|---|---|---|---|
| P: probability. | ||||
| Liver metastasis | colon | P: 0.766581 | P: 0.804848 | 0.160 |
| rectum | P: 0.540414 | P: 0.596230 | ||
| Lung metastasis | colon | P: 0.424453 | P: 0.504118 | 0.579 |
| rectum | P: 0.529350 | P: 0.607908 | ||
| Characteristics | Relative Risk | CI (Confidence interval) 95% | P-value |
|---|---|---|---|
| K-RAS mutation | -1.76 | -0.9537 - 0.0501 | 0.078 |
| Cell differentiation, | -0.79 | -0.8236 - 0.3492 | 0.428 |
| Gender | -0.74 | -0.6267 - 0.2829 | 0.459 |
| Age | 0.47 | -0.0118 - 0.0191 | 0.642 |
| Primary tumor site | 1.16 | -0.1708 - 0.6679 | 0.245 |
| Lymph node involvement | -1.62 | -0.8142 - 0.0763 | 0.104 |
| Liver metastasis | 2.65 | 0.2427 - 1.6257 | 0.008 |
| Lung metastasis | -1.56 | 0.7462 - 0.0859 | 0.120 |
| Synchronous metastasis | 2.92 | 0.2961 - 1.4998 | 0.003 |
| Histological type | -0.70 | -0.6845 - 0.3248 | 0.485 |