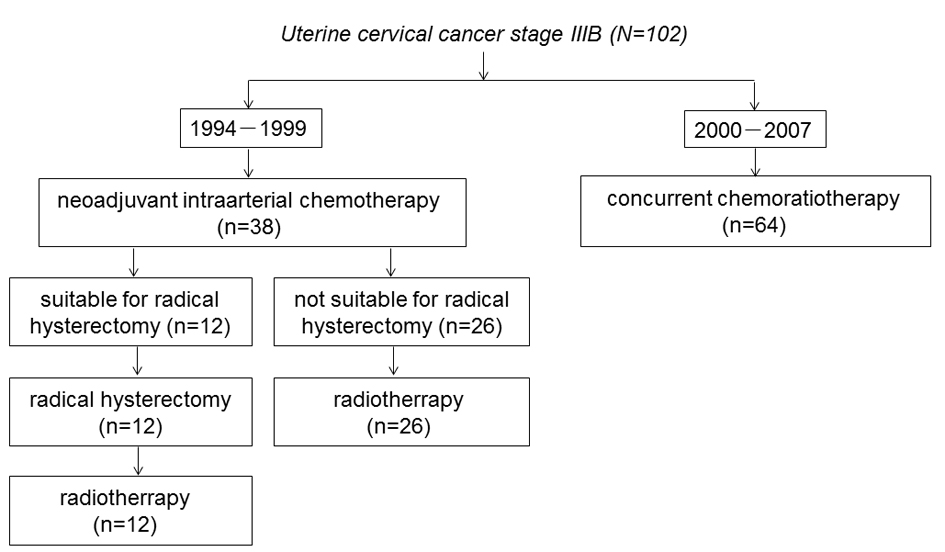
Figure 1. The trial profile of the flow of patients.
| World Journal of Oncology, ISSN 1920-4531 print, 1920-454X online, Open Access |
| Article copyright, the authors; Journal compilation copyright, World J Oncol and Elmer Press Inc |
| Journal website http://www.wjon.org |
Original Article
Volume 4, Number 6, December 2013, pages 221-229
Comparison of Neoadjuvant Intraarterial Chemotherapy Versus Concurrent Chemoradiotherapy in Patients With Stage IIIB Uterine Cervical Cancer
Figures
Tables
| IA-NAC group (n = 38) | CCRT group (n = 38) | P value | |
|---|---|---|---|
| Age (years) | |||
| Mean ± SD | 56.2 ± 9.0 | 58.9 ± 12.4 | 0.612 |
| ECOG performance status (n, %) | |||
| 0 | 37 (97.4%) | 60 (93.5%) | 0.857 |
| 1-2 | 1 (2.6%) | 4 (6.5%) | |
| Tumor dimension (mm) | |||
| Mean ± SD | 55.6 ± 16.7 | 47.5 ± 14.9 | 0.012 |
| Pelvic lymph node status (n, %) | |||
| Negative | 23 (60.5%) | 54 (84.4%) | 0.071 |
| Positive | 15 (39.5%) | 11 (17.2%) | |
| Serum SCC (ng/ML) | |||
| Mean ± SD | 25.1 ± 33.0 | 24.1 ± 38.8 | 0.893 |
| ARH group (n = 12) | RT group (n = 26) | P value | |
|---|---|---|---|
| Age (years) | |||
| Mean ± SD | 53.7 ± 8.6 | 57.3 ± 9.1 | 0.246 |
| ECOG performance status (n, %) | |||
| 0 | 12 (100%) | 26 (93.5%) | 0.857 |
| 1-2 | 0 (0%) | 1(6.5%) | |
| Tumor dimension (mm) | |||
| Mean ± SD | 53.8 ± 1637 | 56.4 ± 17.2 | 0.659 |
| Pelvic lymph node status (n, %) | |||
| Negative | 7 (58.3%) | 16 (61.5%) | 0.583 |
| Positive | 5 (41.7%) | 10 (38.5%) | |
| Serum SCC (ng/ML) | |||
| Mean ± SD | 10.9 ± 10.2 | 31.6 ± 37.7 | 0.073 |
| IA-NAC group (n = 38) | CCRT group (n = 64) | |||
|---|---|---|---|---|
| No. of patients | % | No. of patients | % | |
| Complete response | 15 | 39.4 | 26 | 40.6 |
| Partial response | 18 | 47.4 | 37 | 57.8 |
| Stable disease | 5 | 13.2 | 1 | 1.6 |
| Response rate | 33 | 86.8 | 63 | 98.4 |
| Outcome | IA-NAC group (n = 38) | CCRT group (n = 64) | ||
|---|---|---|---|---|
| No. of patients | % | No. of patients | % | |
| Progression status | ||||
| Relapse | 20 | 33 | ||
| Local | 9 | 23.7 | 22 | 34.3 |
| Distant | 9 | 23.7 | 6 | 9.3 |
| Combined | 2 | 5.2 | 2 | 3.1 |
| No evidence of disease | 18 | 47.4 | 31 | 48.3 |
| Survival status | ||||
| Dead | 17 | 44.7 | 34 | 53.1 |
| Alive | 21 | 55.3 | 30 | 46.9 |