Figures
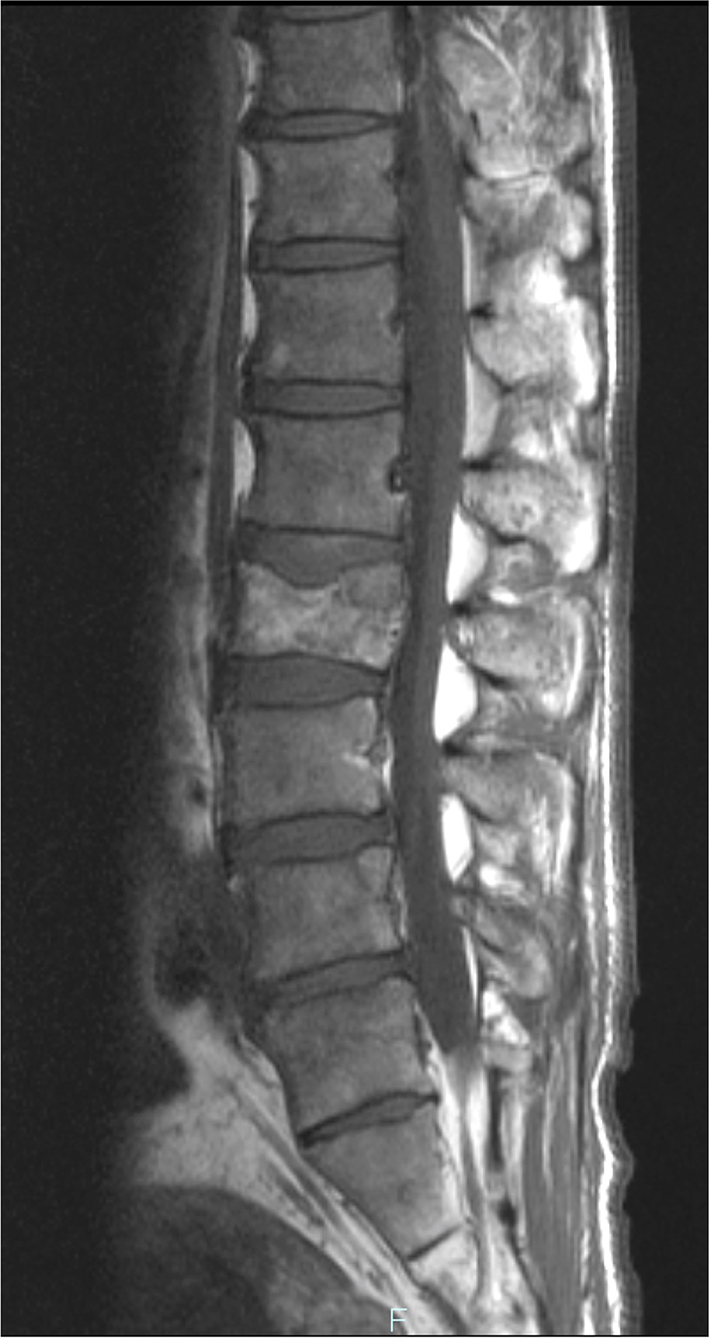
Figure 1. Spinal MRI. T1-weighed MR image showed metastatic lesions spread widely in the vertebral bodies.
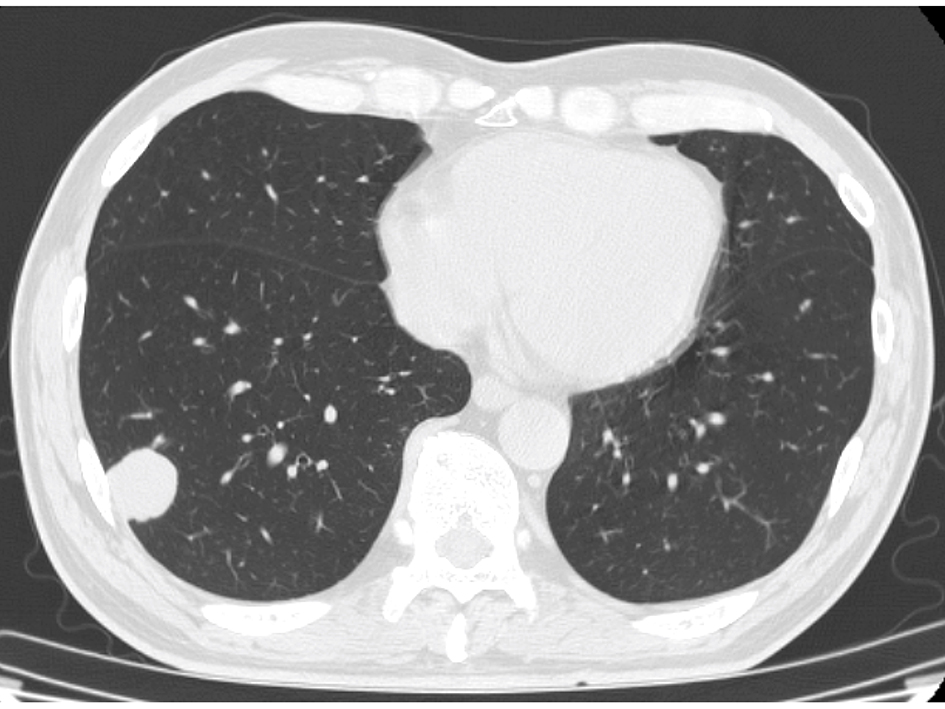
Figure 2. Chest CT. A well-defined right lung tumor of 25 mm in diameter.
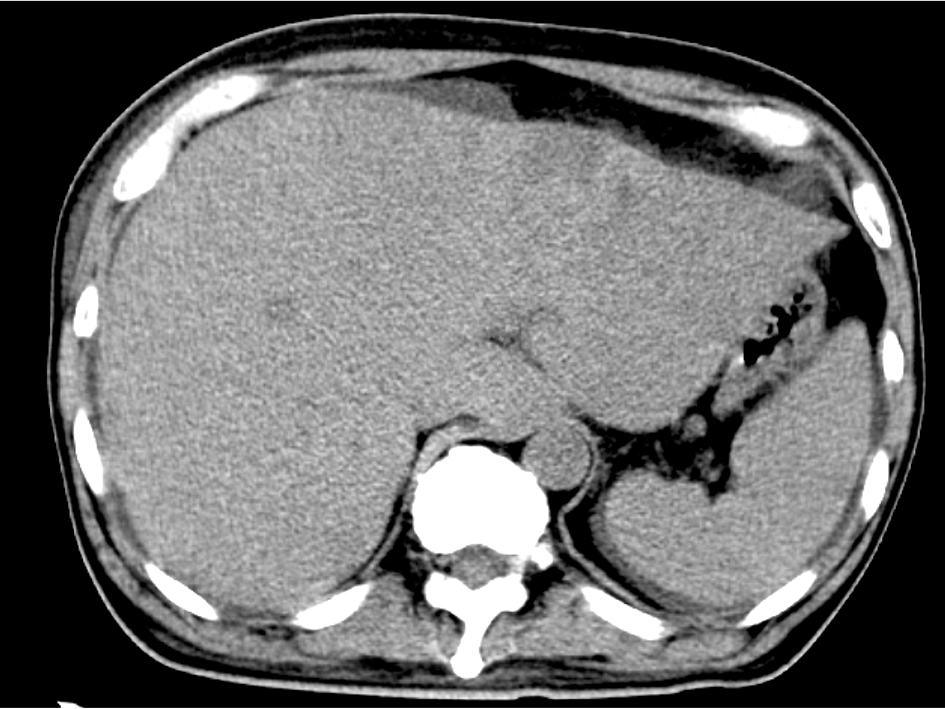
Figure 3. Abdominal CT. Diffuse hypo-density area in the swelled liver with ascites.
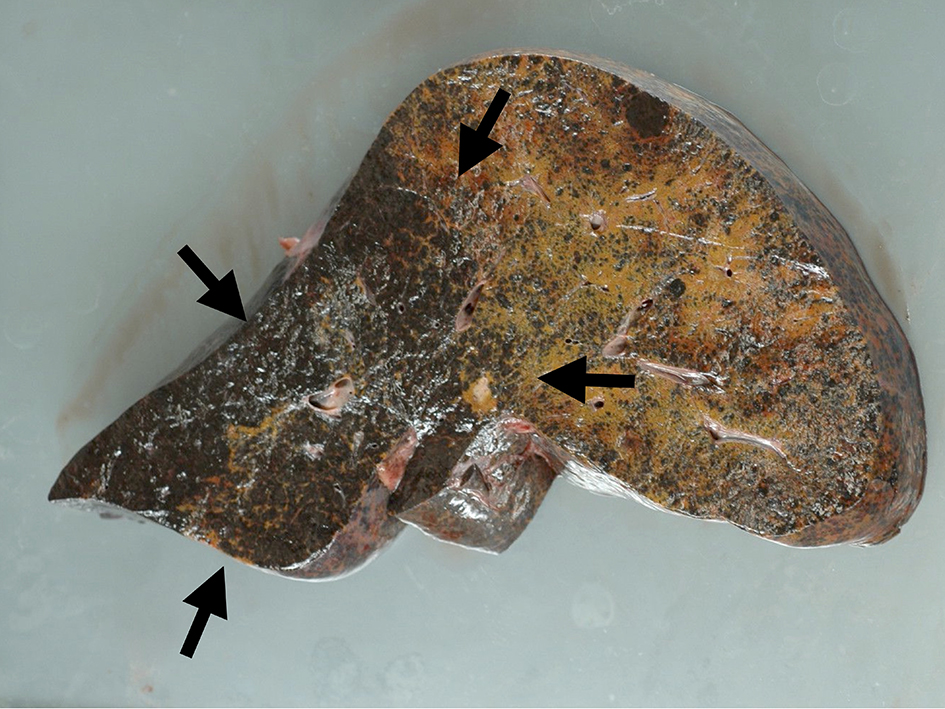
Figure 4. Macroscopic view of liver cut surface. Blackish swelled liver showed diffuse metastatic melanocyte invasion (arrows).
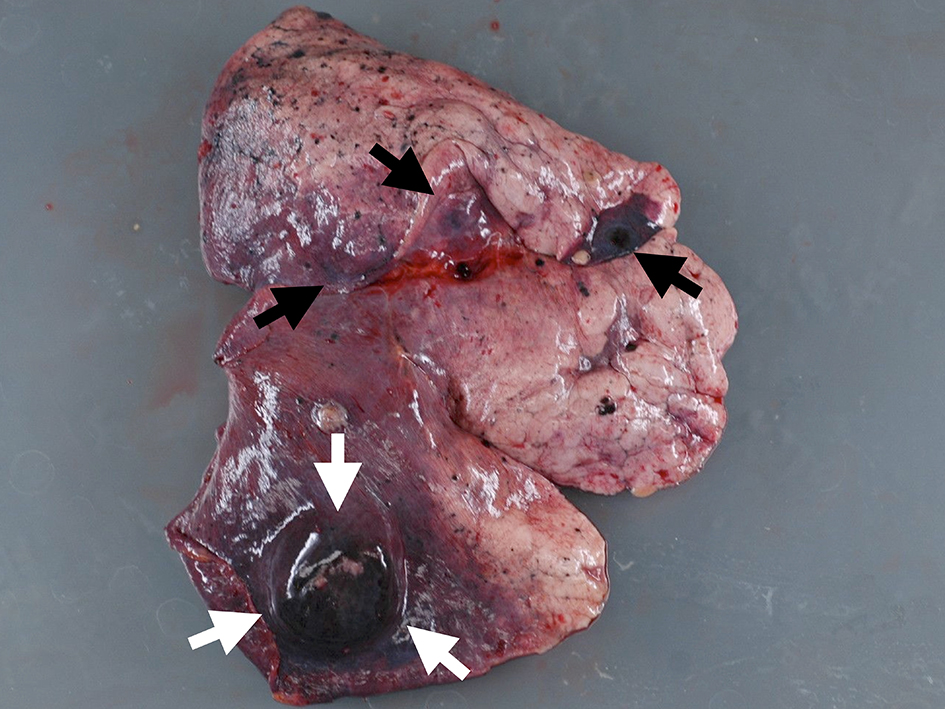
Figure 5. Macroscopic view of lung lesion. Well-defined metastasis (white arrows) was accompanied with multiple metastases (black arrows).
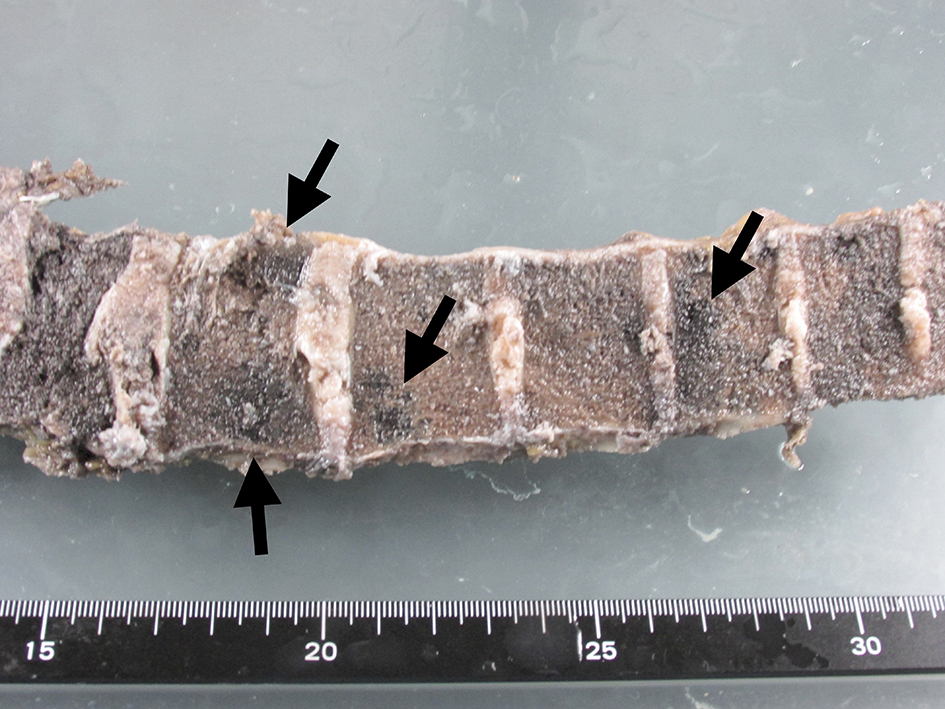
Figure 6. Macroscopic view of lumber spine. Metastatic lesions were spread in the vertebrae (arrows).
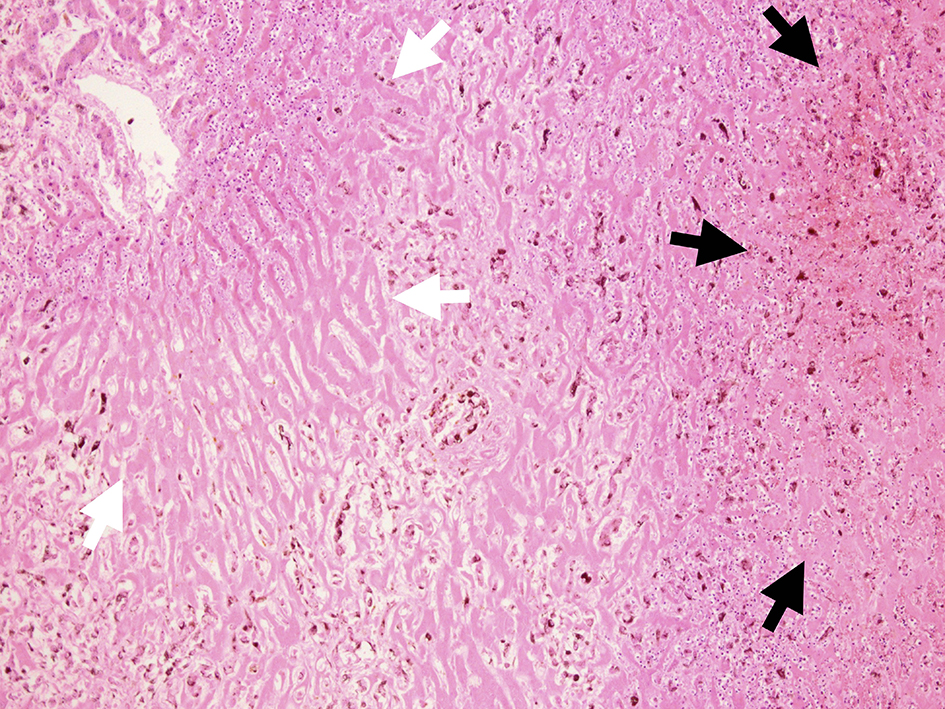
Figure 7. Microscopic view of liver cut surface. Centrilobular necrosis without bleeding (white arrow) and perilobular necrosis with hemorrhage were shown (black arrow). Diffuse invasion of atypical melanocytes was observed.
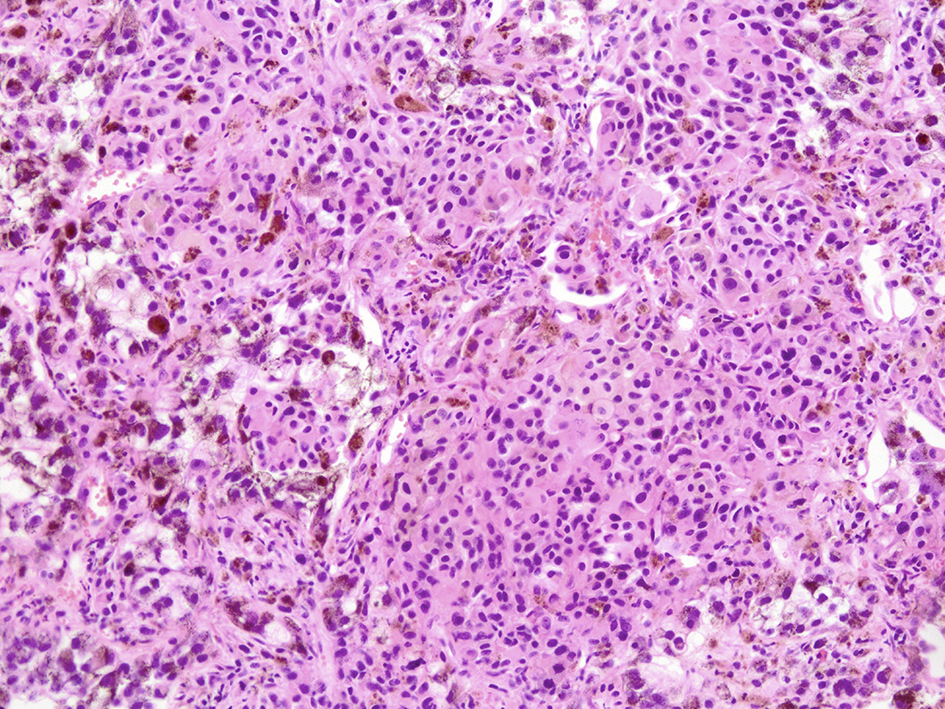
Figure 8. Microscopic view of lung lesion on autopsy. Lung metastasis with diffuse necrosis taken by autopsy was shown.
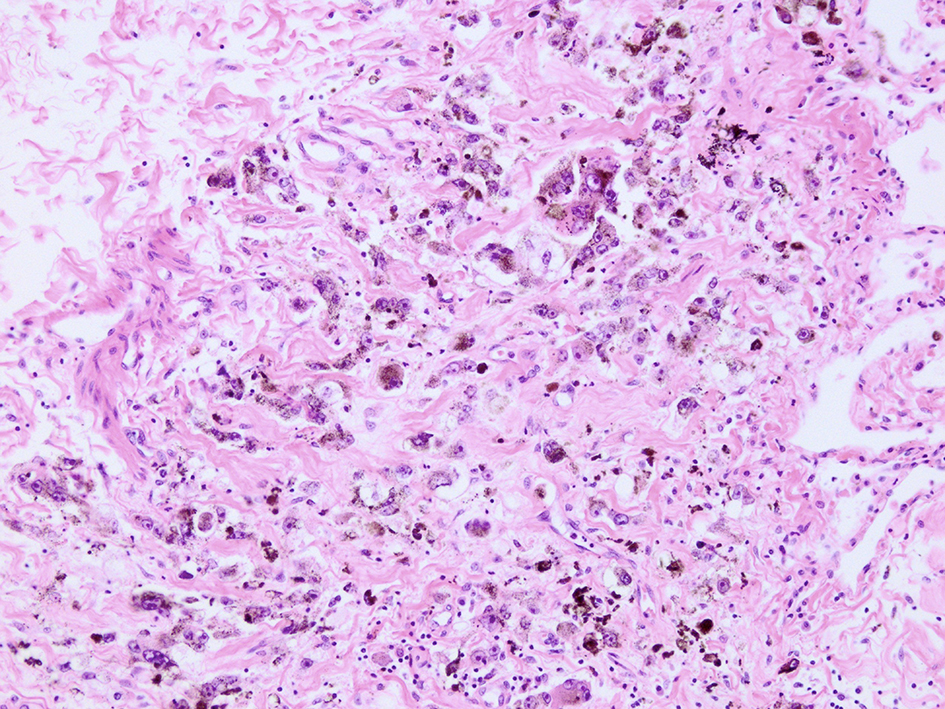
Figure 9. Microscopic view of lung lesion on biopsy. Lung metastasis without necrosis was shown.
Table
Table 1. Indexes of Tumor Lysis Syndrome During Clinical Course
| Time after admission (h) |
|---|
| 0 | 36 | 58 |
|---|
| T.Bil (mg/dL) | 4.34 | 6.71 | 9.63 |
| LDH (IU/L) | 8,756 | 20,223 | 52,700 |
| UA (mg/dL) | 8.5 | 13.9 | 0.9 |
| P (mg/dL) | 3.6 | 6.8 | 12.6 |
| K (mEq/L) | 5.1 | 6.2 | 7.9 |
| Ca (mg/dL) | 9.4 | 8.2 | 7.9 |