

| World Journal of Oncology, ISSN 1920-4531 print, 1920-454X online, Open Access |
| Article copyright, the authors; Journal compilation copyright, World J Oncol and Elmer Press Inc |
| Journal website https://www.wjon.org |
Original Article
Volume 15, Number 3, June 2024, pages 492-505
Synergistic Effects of Neratinib in Combination With Palbociclib or Miransertib in Brain Cancer Cells
Figures
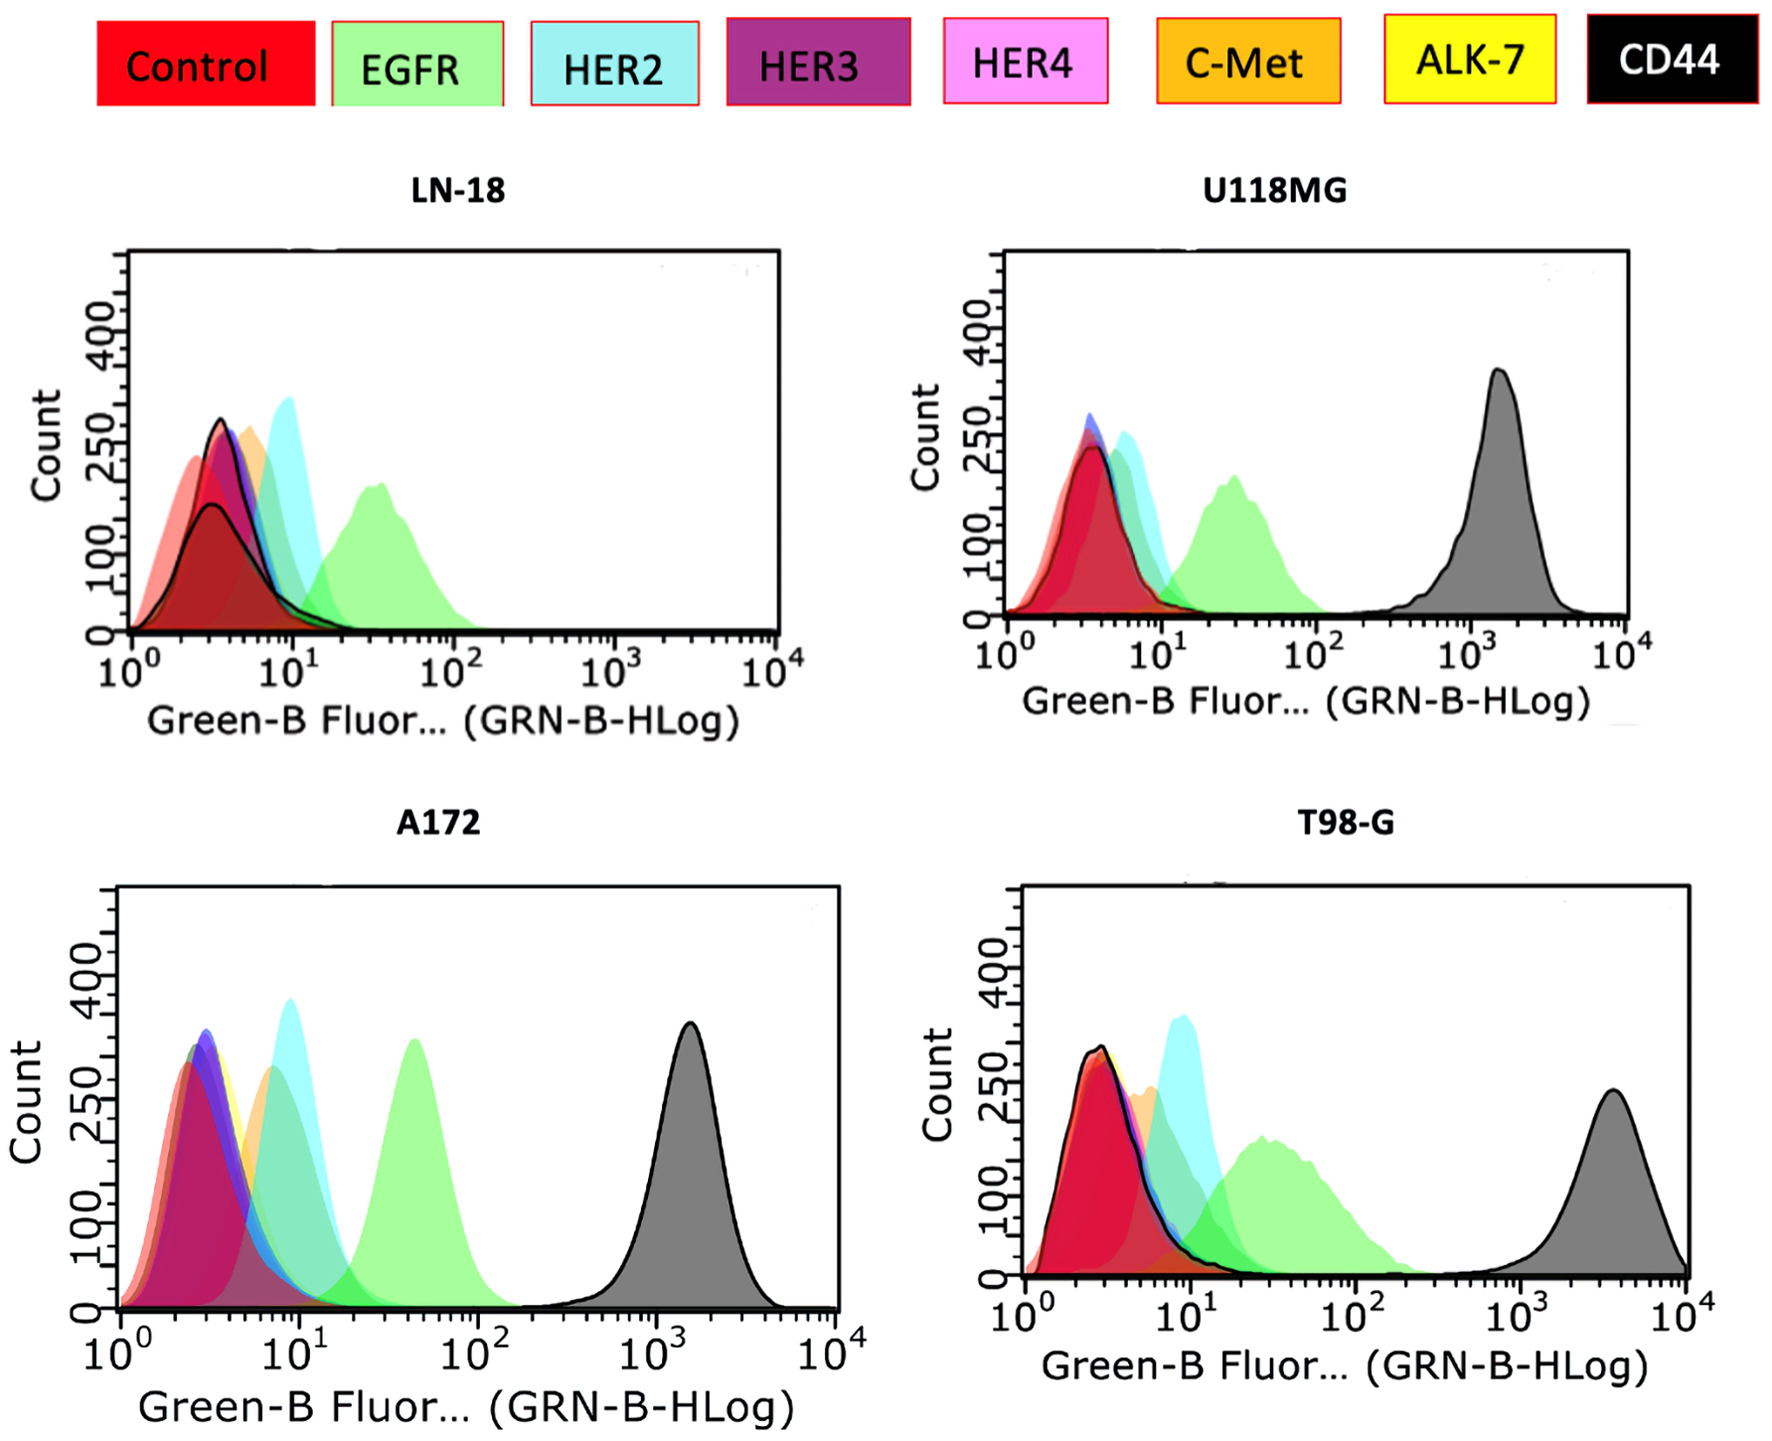
Figure 1. The expression levels of various growth factor receptors in human brain cancer cell lines determined by flow cytometry and represented as histograms. EGFR: epidermal growth factor receptor; HER: human epidermal growth factor receptor; c-MET: mesenchymal-epithelial transition factor; ALK7: anaplastic lymphoma kinase 7: CD44: cluster differentiation 44.
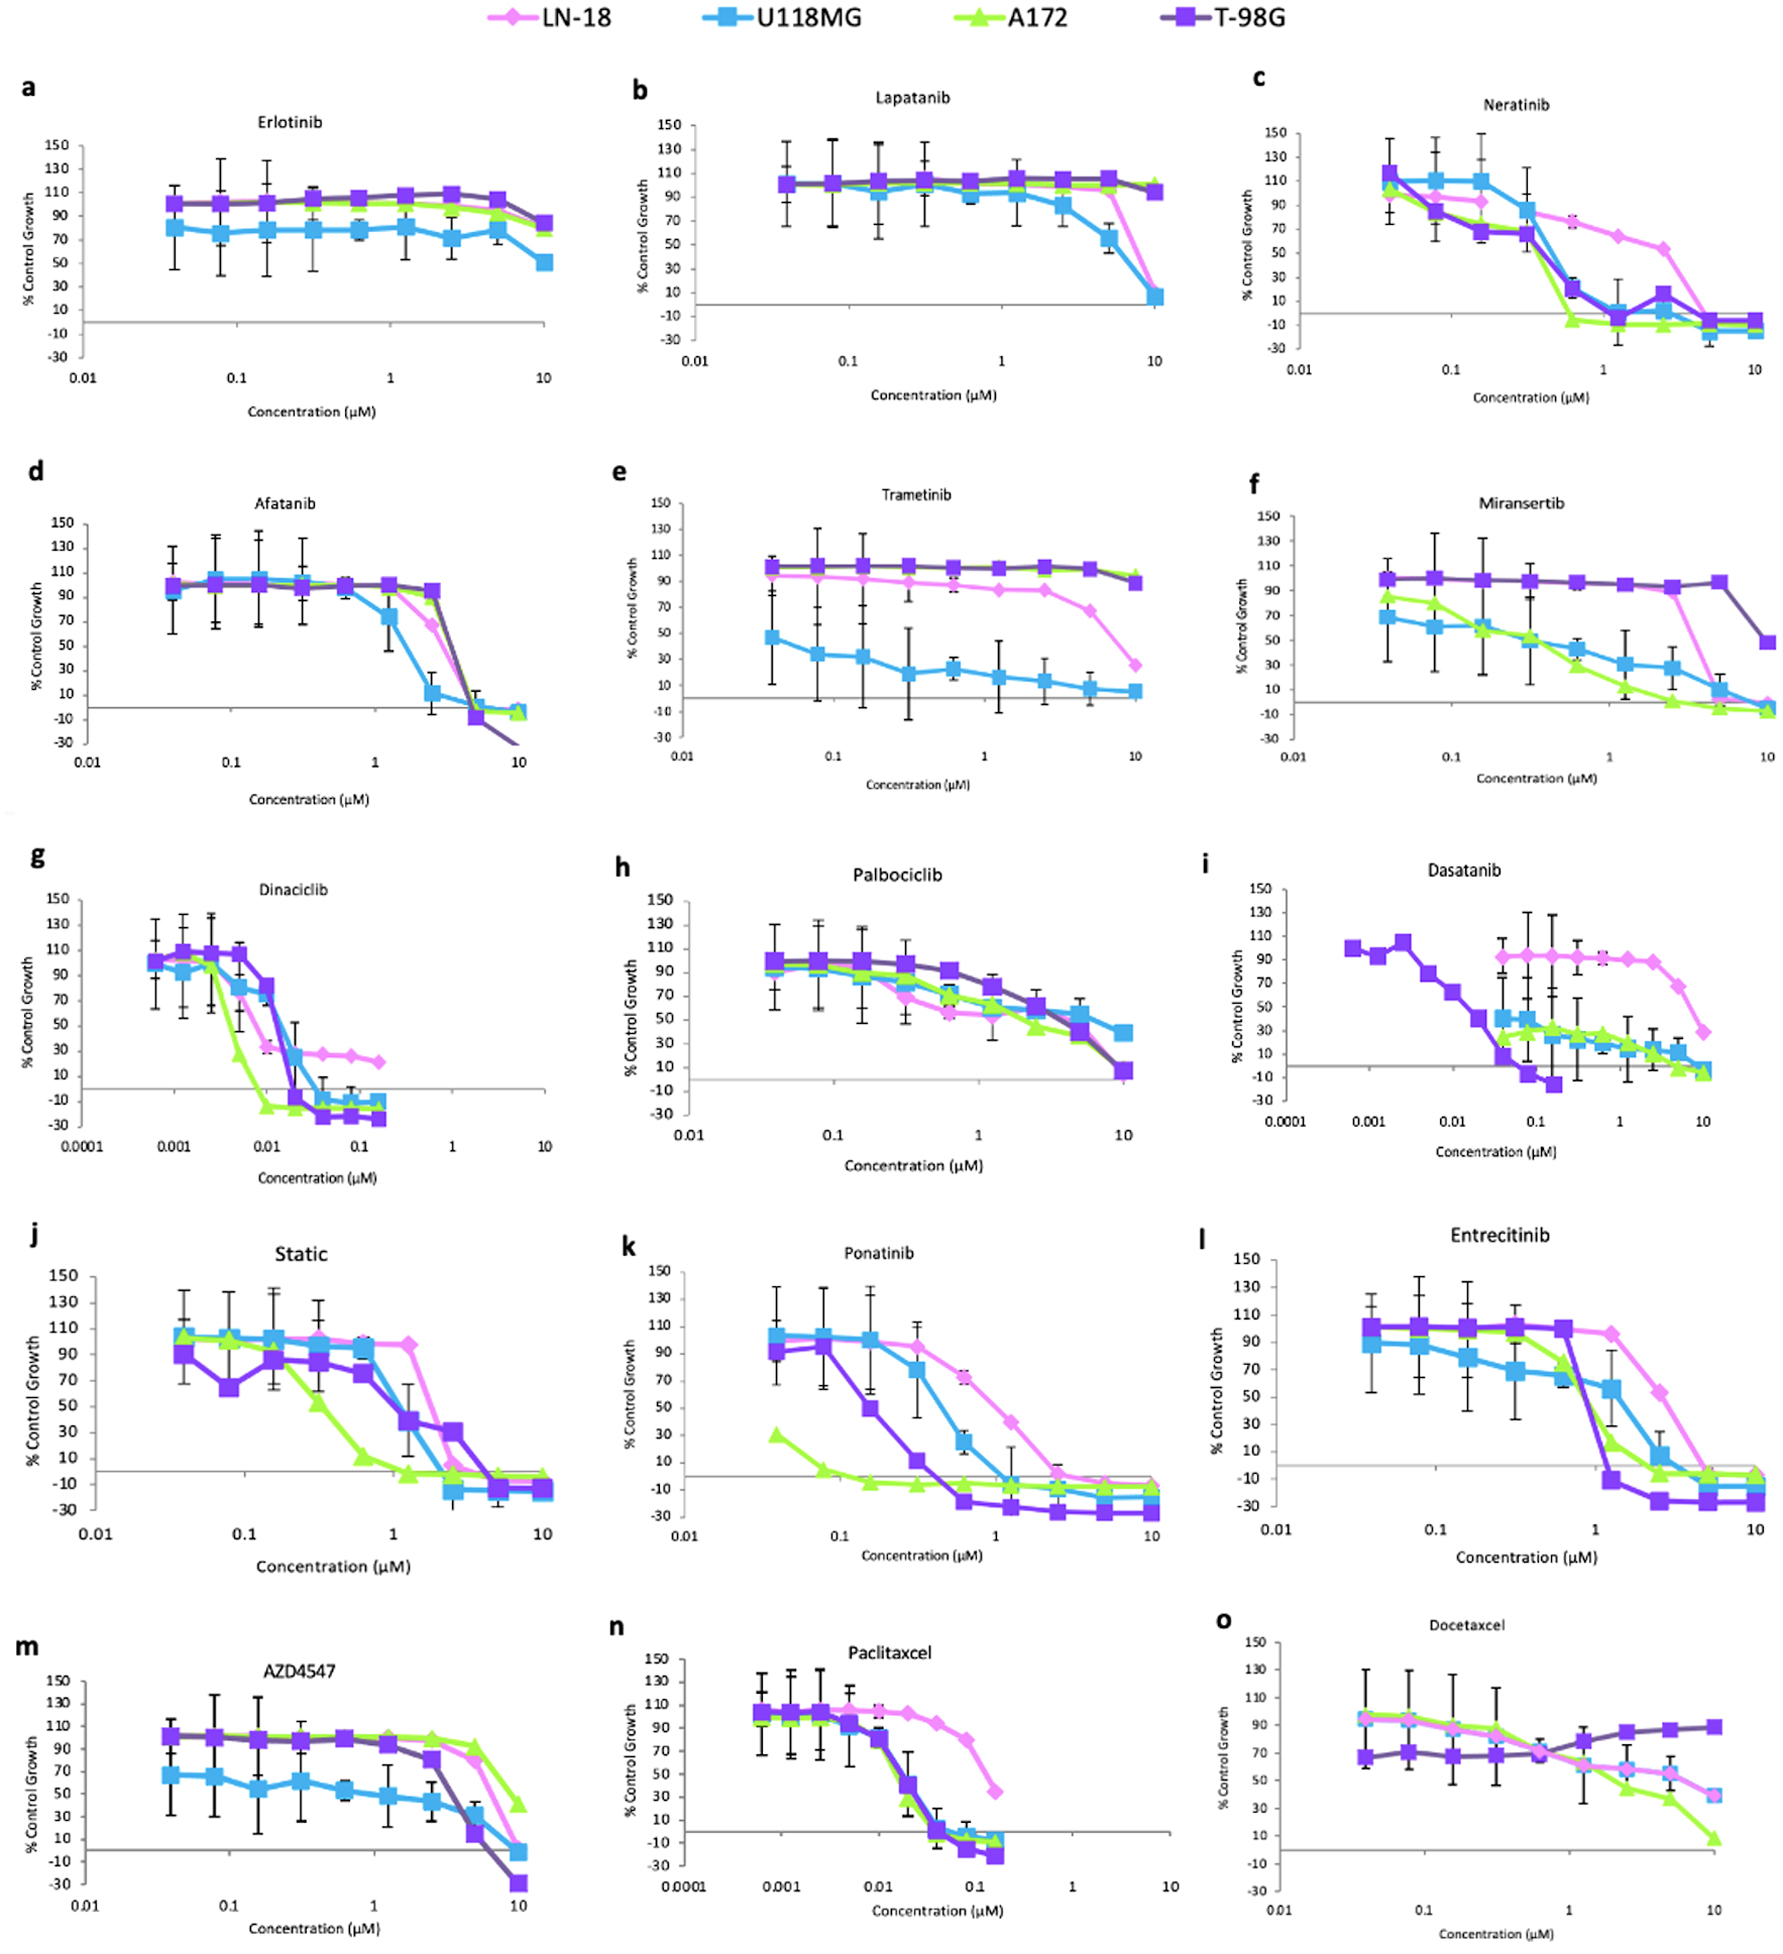
Figure 2. Effect of doubling dilutions of various agents targeting HER family members and other cell signaling molecules on the growth of brain cancer cells when cultured in medium containing 2% FBS. Tumor cells that were examined when grown in control wells (i.e., only medium) were confluent. Each point represents the mean ± SD of the triplicate sample. FBS fetal bovine serum; HER: human epidermal growth factor receptor; SD: standard deviation.
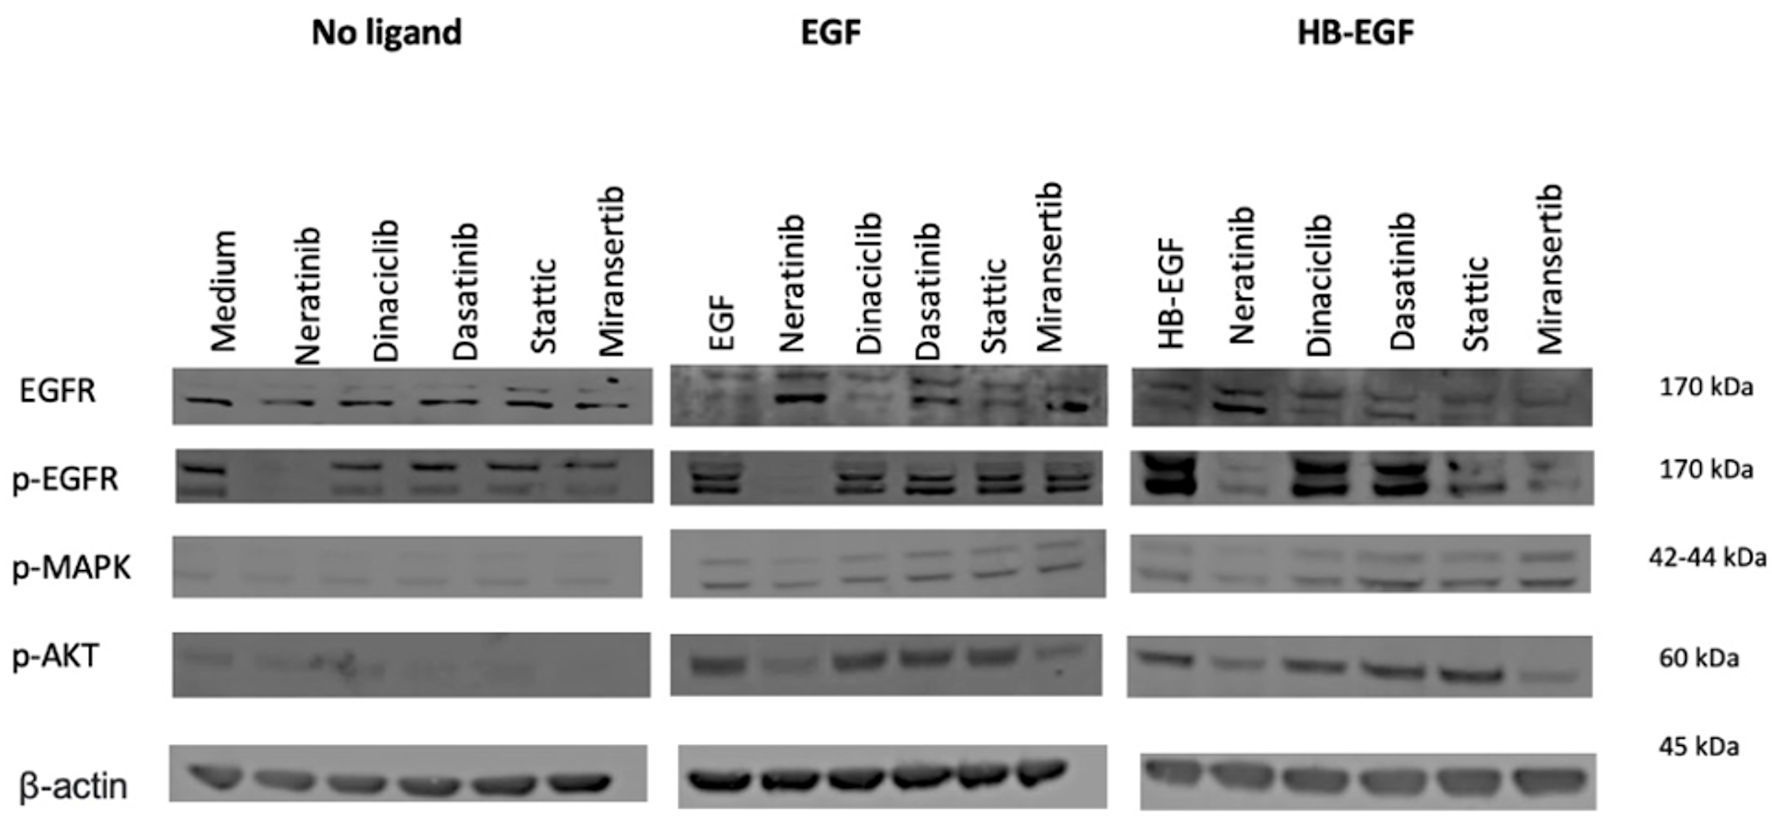
Figure 3. Effects of tyrosine kinase inhibitors (TKIs) on cell signaling on brain tumor cell line A172 in the presence or absence of ligands. The cells were cultured in 10% FBS DMEM medium to near confluency. Cells were washed once with 0.5% FBS DMEM medium and incubated with selected agents (400 nM) for 1 h and then stimulated with 30 nM ligands (EGF or HB-EGF) for 15 min. Cells were then lysed, separated using SDS-PAGE, transferred onto PVDF membranes, probed with the antibodies of interest, and visualized using LI-COR software. DMEM: Dulbecco’s modified Eagles medium; SDS-PAGE: sodium dodecyl sulfate polyacrylamide gel electrophoresis; PVDF: polyvinylidene fluoride; EGF: epidermal growth factor; HB-EGF: heparin-binding EGF-like growth factor; EGFR: epidermal growth factor receptor; MAPK: mitogen-activated protein kinase; AKT: serine/threonine protein kinase; STAT3: signal transducer and activator of transcription 3; SRC: proto-oncogene tyrosine kinase SRC.
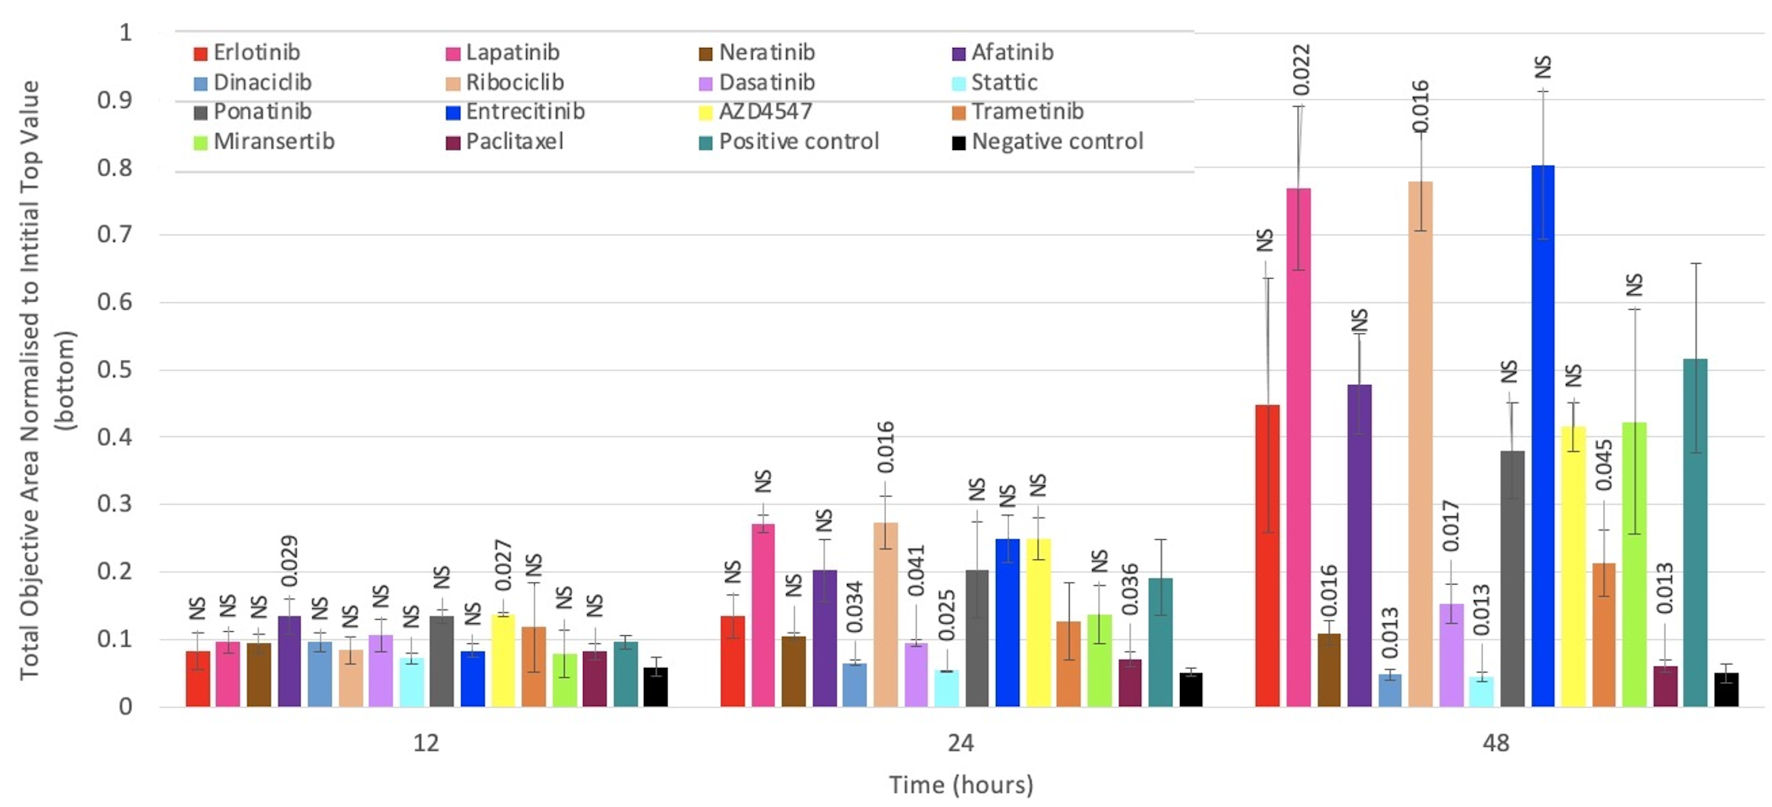
Figure 4. The effect of various agents on migration of brain cancer cell line A172. Migration is determined using the IncuCyte Clear View 96 well IncuCyte Chemotaxis system. Cells were seeded into the top layer of a 96-well cell migration assay plate in 0.5% FBS DMEM together with TKIs at IC50 concentrations, while 10% FBS DMEM (chemoattractant) was added to the bottom layer. Cells were incubated at 37 °C for 48 h, with images taken from chamber wells and were analyzed every 3 h for 48 h using the IncuCyte chemotaxis software. Most TKIs inhibited migration of A172 cell line, to varying degrees. Each point is a representative of the mean ± SD of triplicate samples. NS: not significant; IC50: 50% inhibitory concentration; TKIs: tyrosine kinase inhibitors; SD: standard deviation; FBS fetal bovine serum; DMEM: Dulbecco’s modified Eagles medium.
Tables
| Cell line | Mean fluorescence intensity (MFI) | |||||||
|---|---|---|---|---|---|---|---|---|
| Control | EGFR | HER2 | HER3 | HER4 | C-MET | ALK-7 | CD44 | |
| The data are presented as the mean fluorescence intensity (MFI) ± standard deviation (SD) of gated events. N/A: not available. ALK anaplastic lymphoma kinase; c-MET: hepatocyte growth factor receptor; CD: cluster differentiation; EGFR: epidermal growth factor receptor; HER: human epidermal growth factor receptor. | ||||||||
| LN-18 | 3.7 | 32.9 | 8.8 | 4.2 | 3.9 | 5.8 | 4.4 | 3.9 |
| U118MG | 3.5 | 28.5 | 5.8 | 3.9 | 4.0 | 5.4 | 3.9 | 1,354.6 |
| A172 | 3.0 | 43.6 | 9.4 | 3.5 | 3.4 | 7.7 | 3.8 | 1,439.0 |
| T-98G | 3.2 | 33.8 | 8.9 | 3.5 | 3.6 | 5.9 | 3.6 | 3,259.8 |
| HN5 | 2.9 | 1071.7 | N/A | N/A | N/A | N/A | N/A | N/A |
| SKOV3 | 3.8 | N/A | 233.3 | N/A | N/A | N/A | N/A | N/A |
| CaCo2 | 2.4 | N/A | N/A | N/A | N/A | N/A | N/A | 49.51 |
| IC50 value (µM) | % FBS | LN-18 | A172 | U118MG | T-98G |
|---|---|---|---|---|---|
| Each value is the mean of triplicate samples. IC50: 50% inhibitory concentration; SRB: sulforhodamine B; TKIs: tyrosine kinase inhibitors; STAT: signal transducer and activator of transcription; Abl: Abelson murine leukemia viral oncogene homolog; AKT: serine/threonine protein kinase; ALK anaplastic lymphoma kinase; c-MET: hepatocyte growth factor receptor; CDK: cyclin dependent kinase; EGFR: epidermal growth factor receptor; EPGN: epithelial mitogen; FBS fetal bovine serum; FGFR: fibroblast growth factor receptor; HBCCLs: human brain cancer cell lines; HER: human epidermal growth factor receptor; PDGFR: platelet-derived growth factor receptor; VEGFR: vascular endothelial growth factor. | |||||
| A | |||||
| Erlotinib (EGFR inhibitor) | 2% | 6.42 | 10.00 | 7.45 | 6.84 |
| 10% | > 10.00 | > 10.00 | > 10.00 | > 10.00 | |
| Lapatinib (EGFR/HER2 inhibitor) | 2% | 1.08 | 10.00 | 5.60 | 3.25 |
| 10% | 8.55 | 10.00 | 6.39 | 10.00 | |
| Neratinib (EGFR/HER2/HER4 inhibitor) | 2% | 0.30 | 0.35 | 0.33 | 0.69 |
| 10% | 1.55 | 1.12 | 0.44 | 1.94 | |
| Afatinib (EGFR/HER2/HER4 inhibitor) | 2% | 1.11 | 1.24 | 1.49 | 1.85 |
| 10% | 2.97 | 2.50 | 1.42 | 4.04 | |
| Palbociclib (CDK4/CDK6 inhibitor) | 2% | 1.94 | 1.16 | 0.45 | 0.56 |
| 10% | 2.07 | 4.69 | 2.46 | 4.78 | |
| Dinaciclib (CDK1/CDK2/ CDK5/CDK9) | 2% | 0.006 | 0.004 | 0.014 | 0.013 |
| 10% | 0.008 | 0.003 | 0.0125 | 0.010 | |
| Ribociclib (CDK4/CDK6 inhibitor) | 2% | 1.62 | 5.76 | 1.43 | 5.50 |
| 10% | 5.80 | 4.13 | 1.00 | > 10.00 | |
| Capmatinib (C-MET inhibitor) | 2% | > 10.00 | > 10.00 | 4.22 | > 10.00 |
| 10% | > 10.00 | > 10.00 | > 10.00 | > 10.00 | |
| Dasatinib (Abl/Src/c-Kit) | 2% | 0.041 | 0.04 | 0.01 | 0.01 |
| 10% | 1.80 | 2.96 | 0.10 | 0.06 | |
| Stattic (STAT3 inhibitor) | 2% | 1.21 | 0.61 | 1.13 | 9.68 |
| 10% | 3.76 | 0.72 | 1.00 | > 10.00 | |
| B | |||||
| Ponatinib (Abl/ PDGFRα/VEGFR2/FGFR1 inhibitor) | 2% | 0.10 | 0.03 | 0.40 | 0.19 |
| 10% | 0.41 | 0.19 | 0.88 | 0.42 | |
| Entrectinib (TrkA/B/C/ROS/ALK inhibitor) | 2% | 0.11 | 0.78 | 1.19 | 0.95 |
| 10% | 2.95 | 2.85 | 2.93 | 3.47 | |
| AZD4547 (FGFR 1/2/3 inhibitor) | 2% | 1.61 | 0.01 | 4.90 | 0.39 |
| 10% | 6.62 | 2.68 | 4.10 | 3.83 | |
| Trametinib (MEK 1/2 inhibitor) | 2% | 0.02 | 0.01 | 0.17 | 0.12 |
| 10% | 6.29 | 0.105 | 0.04 | >10.00 | |
| Selumetinib (MEK/ERK1/ERK2 inhibitor) | 2% | > 10.00 | 6.72 | > 10.00 | >10.00 |
| 10% | 8.40 | 4.39 | 4.20 | >10.00 | |
| Miransertib (AKT1/2/3 inhibitor) | 2% | 0.60 | 3.03 | 5.25 | 2.56 |
| 10% | 3.25 | 8.17 | 1.66 | 9.90 | |
| Lorlatinib (ALK/Ros1 inhibitor) | 2% | >10.00 | 9.50 | > 10.0 | 8.76 |
| 10% | 8.91 | 8.79 | 7.20 | > 10.00 | |
| Docetaxel (depolymerisation of microtubules) | 2% | 1.97 | 0.692 | 0.11 | 1.04 |
| 10% | 0.002 | 1.797 | 1.44 | 1.25 | |
| Paclitaxel (microtubule polymer stabiliser) | 2% | 0.12 | 0.015 | 0.018 | 0.01 |
| 10% | 0.03 | 0.039 | 0.002 | 0.03 | |
| Cell lines | Cell cycle phase (% of gated cells) | ||||
|---|---|---|---|---|---|
| Treatment | Sub G1 | G0/G1 | S | G2/M | |
| Each value is expressed as mean ± standard deviation (SD). HER: human epidermal growth factor receptor. | |||||
| LN-18 | Control | 0.8 ± 0.02 | 73.7 ± 3.9 | 9.6 ± 0.9 | 15.07 ± 4.7 |
| Neratinib | 11.9 ± 1.1 | 71.59 ± 2.8 | 6.2 ± 0.9 | 8.8 ± 2.3 | |
| Dinaciclib | 51.3 ± 7.5 | 33.5 ± 0.2 | 4.4 ± 1.1 | 9.7 ± 4.8 | |
| Dasatinib | 3.9 ± 1.1 | 82.8 ± 8.2 | 9.0 ± 0.8 | 10.5 ± 0.4 | |
| Stattic | 98.8 ± 0.3 | 0.81 ± 0.14 | 0.5 ± 0.01 | 0.15 ± 0.05 | |
| Paclitaxel | 11.63 ± 3.9 | 59.6 ± 10.7 | 15.9 ± 1.9 | 13.3 ± 1.5 | |
| U118MG | Control | 6.9 ± 1.1 | 76.9 ± 6.9 | 12.2 ± 7.9 | 3.6 ± 0.7 |
| Neratinib | 5.6 ± 4.4 | 84.4 ± 0.6 | 6.05 ± 3.6 | 3.5 ± 1.0 | |
| Dinaciclib | 42.7 ± 18.3 | 50.1 ± 13.3 | 5.4 ± 4.9 | 1.4 ± 0.3 | |
| Dasatinib | 8.2 ± 4.4 | 88.3 ± 3.1 | 2.1 ± 0.7 | 1.0 ± 0.7 | |
| Stattic | 37.5 ± 29.3 | 54.1 ± 19.8 | 8.1 ± 9.6 | 1.5 ± 1.7 | |
| Paclitaxel | 22.1 ± 9.8 | 70.3 ± 13.2 | 10.4 ± 7.5 | 2.9 ± 0.05 | |
| A172 | Control | 2.8 ± 0.9 | 90.4 ± 1.8 | 4.1 ± 0.3 | 2.5 ± 0.01 |
| Neratinib | 45.1 ± 34.1 | 36.3 ± 13.3 | 18.5 ± 21.7 | 2.2 ± 2.2 | |
| Dinaciclib | 67.7 ± 7.3 | 25.8 ± 1.08 | 7.3 ± 7.7 | 0.2 ± 0.3 | |
| Dasatinib | 12.6 ± 5.6 | 72.3 ± 10.6 | 16.5 ± 20.5 | 1.3 ± 0.1 | |
| Stattic | 9.1 ± 9.6 | 82.2 ± 4.5 | 6.8 ± 5.5 | 2.7 ± 1.4 | |
| Paclitaxel | 55.6 ± 13.6 | 25.2 ± 6.4 | 12.4 ± 4.9 | 6.0- ± 3.2 | |
| T-98G | Control | 1.9 ± 1.04 | 88.9 ± 2.3 | 6.7 ± 1.5 | 2.6 ± 0.4 |
| Neratinib | 1.67 ± 0.7 | 83.1 ± 6.8 | 12.9 ± 8.2 | 3.2 ± 0.5 | |
| Dinaciclib | 28.8 ± 0.5 | 3.2 ± 0.07 | 5.07 ± 0.02 | 59.7 ± 0.6 | |
| Dasatinib | 14.1 ± 3.3 | 70.0 ± 2.0 | 13.4 ± 5.6 | 3.5 ± 0.9 | |
| Stattic | 48.3 ± 65.7 | 41.5 ± 52.7 | 8.9 ± 12.2 | 1.5 ± 1.9 | |
| Paclitaxel | 64.1 ± 18.8 | 25.8 ± 13.9 | 7.6 ± 2.9 | 1.9 ± 1.3 | |
| Drug combination | Combination index mean (range) | ||||||
|---|---|---|---|---|---|---|---|
| LN-18 | A172 | T-98G | |||||
| 10% | 2% | 10% | 2% | 10% | 2% | ||
| Combination Index < 0.9 = synergistic effect, 0.9 - 1.1 = additive effect, > 1.1 = antagonistic. HER: human epidermal growth factor receptor. | |||||||
| Neratinib | Palbociclib | 0.43 | 0.18 | 0.68 | 0.45 | 0.34 | 0.88 |
| Dinaciclib | 3.78 | 1.14 | 1.12 | 1.06 | 0.84 | 0.61 | |
| Capmatinib | 0.28 | 0.35 | 1.47 | 1.15 | 0.60 | 0.78 | |
| Dasatinib | 0.75 | 1.78 | 1.82 | 0.71 | 0.75 | 0.88 | |
| Stattic | 0.83 | 0.71 | 0.72 | 1.2 | 9.17 | 0.78 | |
| Ponatinib | 0.63 | 0.97 | 3.1 | 0.97 | 0.99 | 0.85 | |
| AZD4547 | 1.01 | 0.25 | 1.1 | 0.08 | 0.58 | 0.18 | |
| Trametinib | 0.89 | 0.77 | 1.02 | 1.15 | 0.91 | 0.26 | |
| Miransertib | 0.24 | 0.52 | 0.59 | 0.70 | 0.91 | 0.21 | |
| Paclitaxel | 0.34 | 1.44 | 1.27 | 0.87 | 1.37 | 0.85 | |
| Drugs/cell surface markers | 2% | 10% | ||||
|---|---|---|---|---|---|---|
| EGFR | HER2 | CD44 | EGFR | HER2 | CD44 | |
| R2 (P value) | R2 (P value) | R2 (P value) | R2 (P value) | R2 (P value) | R2 (P value) | |
| N/A: not available; TKIs: tyrosine kinase inhibitors; STAT: signal transducer and activator of transcription; CDK: cyclin dependent kinase; EGFR: epidermal growth factor receptor; HER: human epidermal growth factor receptor; CD44: cluster differentiation 44. | ||||||
| Erlotinib | 0.784 (0.114) | 0.717 (0.153) | 0.221 (0.530) | N/A | N/A | N/A |
| Lapatinib | 0.901 (0.051) | 0.634 (0.204) | 0.070 (0.735) | 0.019 (0.863) | 0.528 (0.273) | 0.125 (0.647) |
| Neratinib | 0.164 (0.595) | 0.069 (0.737) | 0.372 (0.390) | 0.531 (0.271) | 0.023 (0.850) | 0.004 (0.941) |
| Afatinib | 0.042 (0.796) | 0.011 (0.897) | 0.775 (0.120) | 0.461 (0.321) | 0.047 (0.783) | 0.004 (0.939) |
| Palbociclib | 0.107 (0.673) | 0.031 (0.824) | 0.694 (0.167) | 0.065 (0.745) | 0.796 (0.108) | 0.004 (0.939) |
| Dinaciclib | 0.023 (0.849) | 0.811 (0.099) | 0.064 (0.746) | 0.543 (0.263) | 0.003 (0.947) | 0.102 (0.681) |
| Ribociclib | 0.049 (0.778) | 0.837 (0.085) | 0.007 (0.916) | 0.476 (0.310) | 0.036 (0.810) | 0.021 (0.855) |
| Dasatinib | 0.226 (0.525) | 0.460 (0.322) | 0.814 (0.098) | 0.152 (0.610) | 0.275 (0.475) | 0.904 (0.032) |
| Stattic | 0.297 (0.455) | 0.012 (0.891) | 0.405 (0.364) | 0.560 (0.251) | 0.002 (0.961) | 0.251 (0.499) |
| Ponatinib | 0.002 (0.958) | 0.328 (0.428) | 0.656 (0.190) | 0.000 (0.985) | 0.479 (0.308) | 0.475 (0.311) |
| Entrectinib | 0.272 (0.479) | 0.066 (0.743) | 0.507 (0.288) | 0.128 (0.643) | 0.126 (0.644) | 0.288 (0.464) |
| AZD4575 | 0.023 (0.850) | 0.481 (0.307) | 0.212 (0.539) | 0.557 (0.254) | 0.692 (0.168) | 0.024 (0.846) |
| Trametinib | 0.000 (0.992) | 0.145 (0.619) | 0.904 (0.049) | 0.813 (0.098) | 0.039 (0.803) | 0.090 (0.700) |
| Selumetinib | N/A | N/A | N/A | 0.856 (0.075) | 0.051 (0.773) | 0.052 (0.771) |
| Miransertib | 0.455 (0.325) | 0.008 (0.909) | 0.308 (0.445) | 0.001 (0.963) | 0.610 (0.219) | 0.000 (0.994) |
| Lorlatinib | 0.047 (0.784) | 0.303 (0.450) | 0.139 (0.627) | 0.310 (0.443) | 0.136 (0.631) | 0.005 (0.927) |
| Docetaxel | 0.222 (0.529) | 0.194 (0.560) | 0.086 (0.707) | 0.009 (0.953) | 0.634 (0.204) | 0.064 (0.747) |
| Paclitaxel | 0.872 (0.066) | 0.218 (0.533) | 0.024 (0.846) | 0.352 (0.407) | 0.308 (0.445) | 0.291 (0.461) |