

| World Journal of Oncology, ISSN 1920-4531 print, 1920-454X online, Open Access |
| Article copyright, the authors; Journal compilation copyright, World J Oncol and Elmer Press Inc |
| Journal website http://www.wjon.org |
Original Article
Volume 10, Number 6, December 2019, pages 199-217
Prognostic Role of Epithelial-Mesenchymal Transition Markers “E-Cadherin, β-Catenin, ZEB1, ZEB2 and p63” in Bladder Carcinoma
Rabab Ahmed Moussaa, c, El Zahraa Ibrahim Khalila, Ahmed Issam Alib
aPathology Department, Faculty of Medicine, Minia University, Minia 61111, Egypt
bUrology Department, Faculty of Medicine, Minia University, Minia 61111, Egypt
cCorresponding Author: Rabab Ahmed Moussa, Pathology Department, Faculty of Medicine, Minia University, Minia 61111, Egypt
Manuscript submitted September 10, 2019, accepted October 29, 2019
Short title: EMT in Bladder Carcinoma
doi: https://doi.org/10.14740/wjon1234
| Abstract | ▴Top |
Background: This study aimed to investigate the expression of epithelial-mesenchymal markers’ E-cadherin, β-catenin, zinc-finger E-box-binding homeobox 1 (ZEB1), zinc-finger E-box-binding homeobox 2 (ZEB2) and p63 in transitional cell carcinoma (TCC) and squamous cell carcinoma (SCC) variants of bladder carcinoma (BC) and their correlation with clinicopathological parameters of prognostic importance.
Methods: In this retrospective study, 91 patients were enrolled (66 with TCC and 25 with SCC). All patients had full clinical and follow-up data and available paraffin blocks. Immunohistochemical analysis was performed and correlated with clinicopathological factors.
Results: In TCC cases, reduced E-cadherin, β-catenin positivity and p63 expression rate were evident in the sitting of increased expression of ZEB1 and ZEB2. Patients with ZEB2 positive tumors were more likely to die compared to those with negative ZEB2 (P = 0.024). Moreover, in patients with muscle-invasive BCs, an intense p63 expression was associated with poor overall survival (OS) (P < 0.001). For patients with SCC, there was a reduction in E-cadherin and β-catenin positivity with elevated p63 expression and concomitant increased ZEB1 and ZEB2 expression. Poor prognosis was evident in association with reduced E-cadherin, positive nuclear β-catenin/reduced membranous β-catenin, ZEB1 and ZEB2 positive cases as well patients with elevated p63 expression (P < 0.001). TCC and SCC cases showed similar poor prognosis in association with elevated p63 expression (P < 0.001).
Conclusions: In both TCC and SCC variants, epithelial-mesenchymal transition (EMT) process is evident; however, its molecular mechanism shows some variations, specifically this notably different p63 expression pattern among two carcinoma variants with the similar impact of elevated p63 expression pattern on prognosis.
Keywords: E-cadherin; β-catenin; ZEB1; ZEB2; p63; Bladder carcinoma
| Introduction | ▴Top |
Bladder cancer is the most common malignancy of the urinary tract. It accounts for about 3.2% of all cancers worldwide and ranks the ninth highest cancer incidence, which is estimated to be 380,000 annually. It is the 13th mortality cause among all cancers with approximately 150,000 yearly deaths worldwide [1]. In Egypt, urinary bladder tumors constitute 30% of all cancer cases with an incidence of 13.5/100,000 patients. It is the third most prevalent cancer and accounts for 12.7% of male cancers with the majority of cases presented with an invasive form. Transitional cell carcinoma (TCC) represents about 90% of bladder cancer. The remaining 10% include squamous cell carcinoma (SCC), adenocarcinoma and other rare types [2]. Bladder carcinoma (BC) has high recurrence and mortality rates. BCs are categorized as non-muscle-invasive (NMIBCs) which occur in 70% to 80% of the cases, whereas the remaining 20% to 30% usually present with the invasive form (MIBCs). Most of the patients with NMIBCs are treated by endoscopic resection; however, the majority of patients have cancer recurrences after resection in 50-70% of the cases. Almost half of the patients with MIBCs usually present with distant metastases at the time of diagnosis [3].
Based on embryological studies, tumor progression and metastasis could be attributed to transformation in epithelial to mesenchymal cells, epithelial-mesenchymal transition (EMT) [4, 5]. During this process, cell-to-cell adhesion molecules are down-regulated and cell polarity may be lost. These changes increase cell migration and invasion of surroundings [6-8].
Loss of epithelial cell-to-cell interactions alters cell morphology and motility [9]. This interaction is mediated by cadherins, which include E-, P-, and N-isoforms [10]. E-cadherin, an epithelial-specific cadherin, plays a key role in selective cell adhesion within epithelial tissues and is necessary for normal cell integrity [11]. This function takes place at the plasma membrane, where β-catenin combines with the cytoplasmic domain of E-cadherin, in conjunction with α-catenin, and binds to the microfilament network of the cytoskeleton [9]. This process is adversely affected during EMT when E-cadherin is down-regulated [12]. Reduction of E-cadherin is associated with translocation of β-catenin from cell membrane to nucleus. The newly located β-catenin activates WNT signaling pathway, resulting in EMT and metastasis formation [13]. Thus, E-cadherin is considered as a suppressor for malignant cell invasion and metastasis, and subsequently, its reduced expression is expected to increase tumor undifferentiation and invasiveness [14].
The EMT is controlled by several transcription factors within the cells, including Slug Snail, Twist, zinc-finger E-box-binding homeobox 1 (ZEB1) and zinc-finger E-box-binding homeobox 2 (ZEB2) [15]. ZEB1 is the vertebrate homologue of the ZFH gene family of zinc finger/homeodomain proteins. It is encoded by the TCF8 gene [16]. It is considered a key inducer of malignant tumor progression [17, 18]. It acts as a transcriptional repressor of E-cadherin through binding to its gene promoter [19, 20]. Smad-interacting protein 1 (SIP1)/ZEB2 is a member of the δEF-1 family, which is a two-handed zinc finger nuclear factor. Its expression is associated with EMT during development. ZEB2 represses the transcription of junctional protein gene coding contributing to the dedifferentiated state. This function is mediated at SIP1-binding sites. Real-time polymerase chain reaction (RT-PCR) has shown evidence of ZEB2 upregulation in several cancer types [21, 22]. Thus, ZEB2 is believed to act as a biomarker of biological aggressiveness and metastasis [16, 23].
Another important transcription factor is p63, which is a member of the p53 family. It has two main isoforms (TAp63 and ΔNp63), each with a distinct function [24, 25]. Normally, TAp63 isoform is essential for the initiation of epithelial stratification and maintenance of basal cells proliferative capacity. It may also be responsible for cell cycle arrest, by transactivating p53 target genes that promote apoptosis. ΔNp63 improves cells proliferation by enhancing cell response to maturation signals [26]. However, during this process, it exerts dominant-negative activities against TAp63 and p53, suggesting its involvement in EMT during tumor progression [27], and thus, it is considered as an oncoprotein [28].
This study aimed at exploring the molecular mechanisms involved in EMT seen in BC. Further, we investigated whether EMT biomarkers could identify aggressive MIBC behavior in Egyptian patients with TCC and SCC.
| Materials and Methods | ▴Top |
This study is a retrospective study that took place at Minia University Hospital and Minia Oncology Center, Minia, Egypt, from 2005 to 2012.
Patients
Ninety-one patients with BC were enrolled in this study, 66 patients with TCC and 25 with SCC. All patients had full clinical and follow-up data and available paraffin blocks. Those patients were treated with curative intent by senior urologists as follows: radical cystectomy was performed for both invasive disease or high-risk superficial TCC for which conservative measures failed and SCC cases. Patients’ data were obtained including age, sex, bilharzial status, and follow-up data.
Histopathological evaluation
The original hematoxylin and eosin (H&E) stained sections were retrieved and re-assessed to confirm the original diagnosis, histopathological type, tumor grade and stage. TCC and SCC were staged according to the American Joint Committee on Cancer guidelines [29] and graded according to the World Health Organization (WHO) classification system for the urinary tract tumors [30].
Immunohistochemistry
Five-µm sections from pre-diagnosed cases were transferred to adhesive slides from representative formalin-fixed, paraffin-embedded blocks. Then they were processed by deparaffinizing in xylene before they were dehydrated in a series of graded ethanol. Then they were prepared for immunohistochemistry staining using the streptavidin-biotin immunoperoxidase complex method. Briefly, endogenous peroxidase activity was blocked by incubation with 3% hydrogen peroxide, for 30 min, at room temperature. Antigen was then retrieved by microwave treatment (600W) for 10 min using 0.01M sodium citrate buffer (pH 6.0). The slides were then left to cool at room temperature before incubation with mouse monoclonal antibody E-cadherin (clone 4A2C7, 1:100 dilution, Thermo Fisher Scientific) for 30 min, pre-diluted rabbit monoclonal antibody β-catenin (clone E247, Thermo Fisher Scientific) for 60 min, mouse monoclonal antibody ZEB1 (clone 2A8A6, 1:200 dilution, Abcam) for 30 min, rabbit polyclonal antibody ZEB2 (1:50 dilution, Abcam) for 30 min, mouse monoclonal antibody p63 (clone 4A4, 1:50 dilution, Abcam) followed by biotinylated secondary antibody for 30 min at room temperature. The reaction was visualized with an avidin-biotin complex immunoperoxidase system using 3,3′ diaminobenzidine (DAB) as a chromogen (Sigma). Sections were then counterstained with Mayer’s hematoxylin, dehydrated, cleared, and mounted with distyrene, plasticizer, and xylene (DPX). Negative control sections were treated with phosphate-buffered saline (PBS) instead of the primary antibody.
Immunohistochemical analysis
All cases were interpreted blindly regardless of the clinicopathological data of the patients. For E-cadherin, membranous expression was graded based on the proportion of positive cells and classified as normal (> 90%) and reduced expression group (0-90%) [31]. For β-catenin, the expression of cancer cells was classified as: > 70% of cell membranes stained as normal, otherwise as reduced, and > 10% of nuclei or cytoplasm stained as positive [32]. For ZEB1 (nucleus) and ZEB2 (plasma membrane or cytoplasm), reactions were categorized as positive (staining of ≥ 5% of cells) or negative (no staining or tumor cells < 5%) [33]. For p63, positive nuclear immunohistochemical reactions were categorized as negative (stained cells < 10%), weak (≥ 10% and < 80% of cells are stained) and high (intense) (stained cells 80-100%) [26].
Statistical analysis
Data were analyzed using the SPSS statistical package version 20. Firstly, a descriptive analysis of clinicopathological features was performed. Associations between immunohistochemical markers expression and various clinicopathological features were assessed using Chi-square test. Spearman’s correlation analysis was used to analyze the correlation between the studied markers. The Kaplan-Meier method was used for survival analysis. P values less than 0.05 were considered to be statistically significant.
This study was approved by the Research Ethics Committee of Faculty of Medicine of Minia University vides approval letter No. 165:2/2019. The Institutional Review Board of Faculty of Medicine of Minia University also approved this study.
| Results | ▴Top |
Patient demographics and clinicopathologic findings
For the TCC patient group (n = 66), the mean age was 59.5 years (range: 44 - 78). For patients with SCC (n = 25), the mean age was 51.5 ± 4.3 years. Patients with SCC were significantly younger than those with TCC (P = 0.03). In the TCC group, 86.4% (n = 57) were men and 13.6% (n = 9) were women; similarly, in the SCC group, a male predominance was also noticed with a man/woman ratio of 5.3:1 (Table 1).
 Click to view | Table 1. Clinicopathological Characteristics of Patients With TCC and SCC |
In TCC patients’ group, carcinoma was low grade in 24.2% (n = 16) and high grade in 75.8% (n = 50). Urinary carcinoma (UC) with superficial invasion (NMI-UC) was diagnosed in 37.9% (n = 25), while UC with muscle invasion (MI-UC) was found in 62.1% (n = 41) cases. For SCC, carcinoma was graded I in one patient (4%), II in 72% (n = 18), and III in 24% (n = 6). Muscle invasion (T2-3) was evident in 88% (n = 22) of the cases. Lymph node (LN) metastasis was diagnosed in 34.8% (n = 23) of the TCC cases and in 24% of SCC. Bilharzias was evident in 45.5% of TCC and in 68% (n = 17) of SCC patients (Table 1).
Association between clinicopathological data and E-cadherin expression
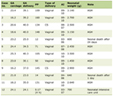
For patients with TCC, 32 tumors (48.5%) showed a normal positive staining pattern and 34 (51.5%) showed reduced E-cadherin expression (Fig. 1a, b). Correlation between E-cadherin expression and histopathological features showed a positive association between reduced expression and tumor grading (P = 0.015) (60% in high grade as compared to only 25% of low-grade types). E-cadherin reduced expression was also seen in 65.9% of MIBCs compared to 28% of NMIBCs (P = 0.003). Regarding LN metastases, 73.9% of node-positive tumors showed reduced expression (P = 0.008, Table 2).
 Click for large image | Figure 1. Representative immunohistochemical staining of E-cadherin in TCCs and SCCs (a-d) (magnification × 200). (a) Preserved normal positive membranous expression in low-grade non-muscle-invasive TCC. (b) Reduced membranous expression in high-grade invasive TCC. (c) Preserved normal positive membranous expression in moderately differentiated SCC. (d) Reduced membranous expression in poorly differentiated SCC. TCC: transitional cell carcinoma; SCC: squamous cell carcinoma. |
Click to view | Table 2. Expression of E-Cadherin, β-Catenin, ZEB1, ZEB2 and p63 in TCC and Their Association With the Clinicopathological Characters |
For patients with SCC, 44% (n = 11) exhibited abnormal reduced E-cadherin expression. Among these, 33.3% (n = 6) were observed in 18 patients with moderate differentiation and 83.3% (n = 5) were found in five patients with poor differentiation. No reduced expression was detected in well-differentiated SCC patients (n = 1). There was a significant association between E-cadherin expression and the degree of differentiation (P = 0.04; Table 3; Fig. 1c, d).
Click to view | Table 3. Expression of E-Cadherin, β-Catenin, ZEB1, ZEB2 and p63 in SCC and Their Association With the Clinicopathological Characters |
Abnormal E-cadherin expression was also observed in 44.4% (n = 8) of the T2 subtype patients (n = 18) as well as in 75% (n = 3) of the four patients with T3 subtype. No reduced expression was reported in T1 non-invasive subtype (n = 1). However, this association between reduced expression and tumor stage did not reach a significant level (P = 0.07, Table 3). On the other hand, a significant association was detected between reduced E-cadherin expression and node-positive tumors (P = 0.026).
Association between clinicopathological data and membranous as well as nucleo-cytoplasmic β-catenin expressions
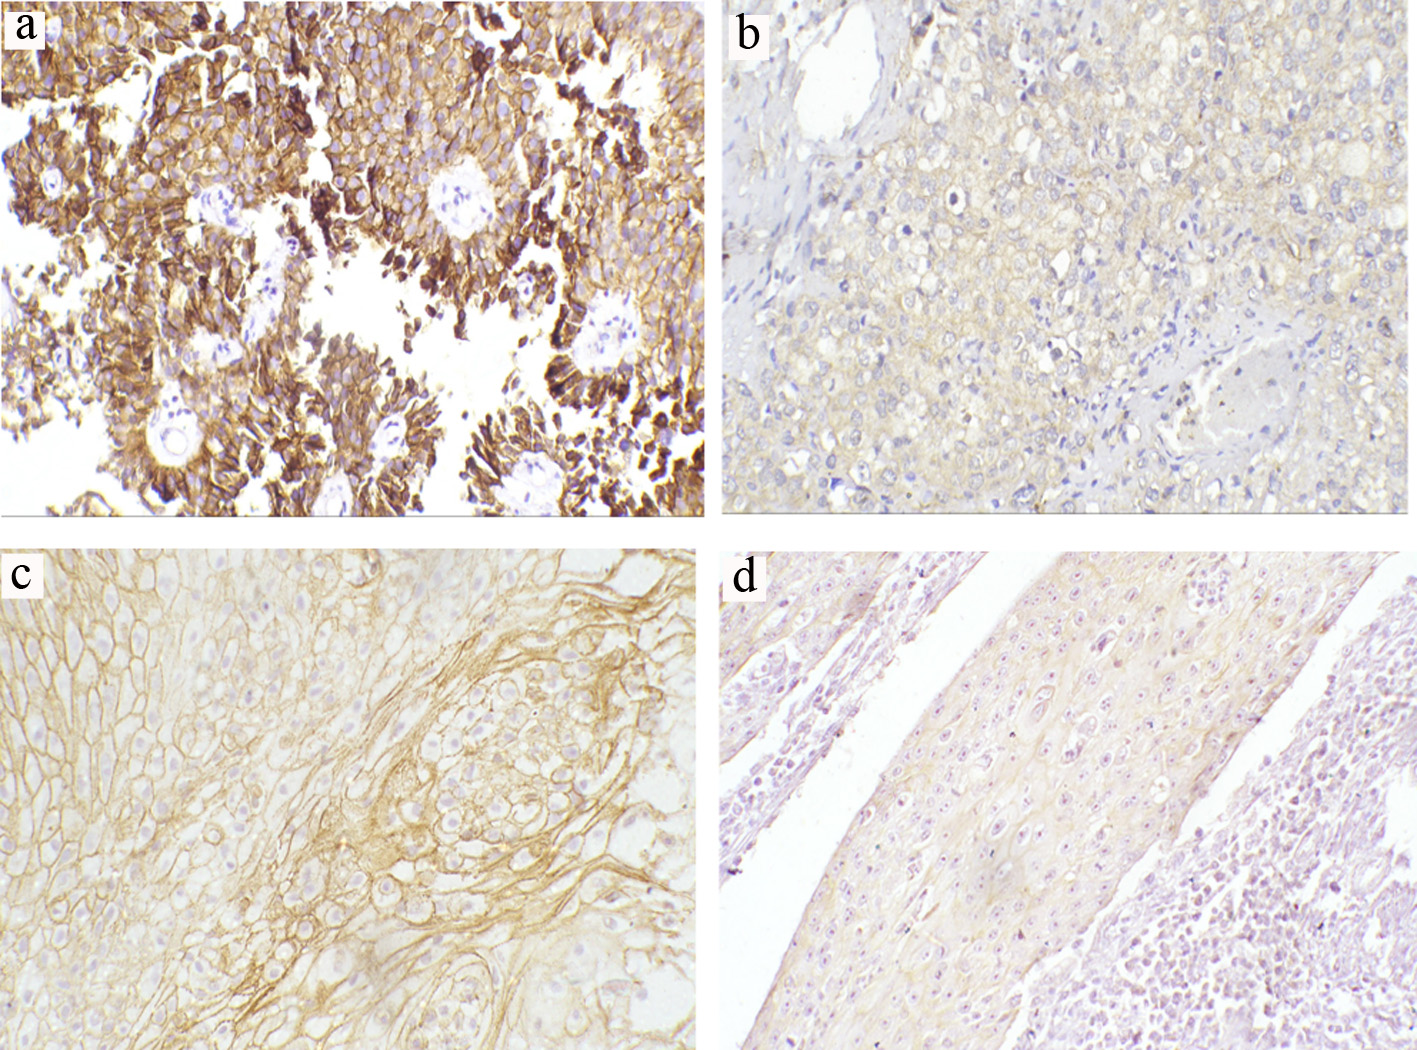
For TCC patients, 75.8% (n = 50) of patients showed reduced β-catenin membranous expression while 51.5% (n = 34) demonstrated ectopic nucleocytoplasmic expression (Fig. 2a-c). There was a significant association between reduced membranous β-catenin and tumor grade (P < 0.001) and stage (P ≤ 0.001). There was also a significant difference in the expression pattern of reduced membranous β-catenin between node-negative and node-positive tumors (P = 0.006). Nucleocytoplasmic localization of β-catenin was significantly and strongly associated with muscle invasion (≥ T2) in 65.9% (n = 27) compared with non-muscle-invasive tumors (28%; n = 7) (P = 0.003). Further, there was a significant correlation with tumor high grade (P < 0.001) (Table 2).
 Click for large image | Figure 2. Representative immunohistochemical staining of β-catenin in TCCs and SCCs (a-e) (magnification × 200). (a) Normal positive membranous expression in low-grade non-muscle-invasive TCC. (b) Reduced membranous expression in high-grade invasive TCC. (c) Predominant nuclear expression in invasive TCC. (d) Reduced membranous expression with prominent cytoplasmic expression in invasive SCC. (e) Nuclear expression in invasive SCC. TCC: transitional cell carcinoma; SCC: squamous cell carcinoma. |
For SCC patients, reduced membranous expression was detected in 56% (n = 14) whereas 36% showed ectopic nucleocytoplasmic expression (Fig. 2d, e). There was a significant correlation between reduced membranous expression and nucleocytoplasmic localization with tumor high grade (P = 0.008 and P = 0.017, respectively). However, only reduced membranous expression showed a significant correlation with high tumor stage (P = 0.008). On the other hand, nucleocytoplasmic β-catenin exhibited a significant correlation with node-positive tumors (P = 0.012) (Table 3).
Association between clinicopathological data and ZEB1 and ZEB2 expression
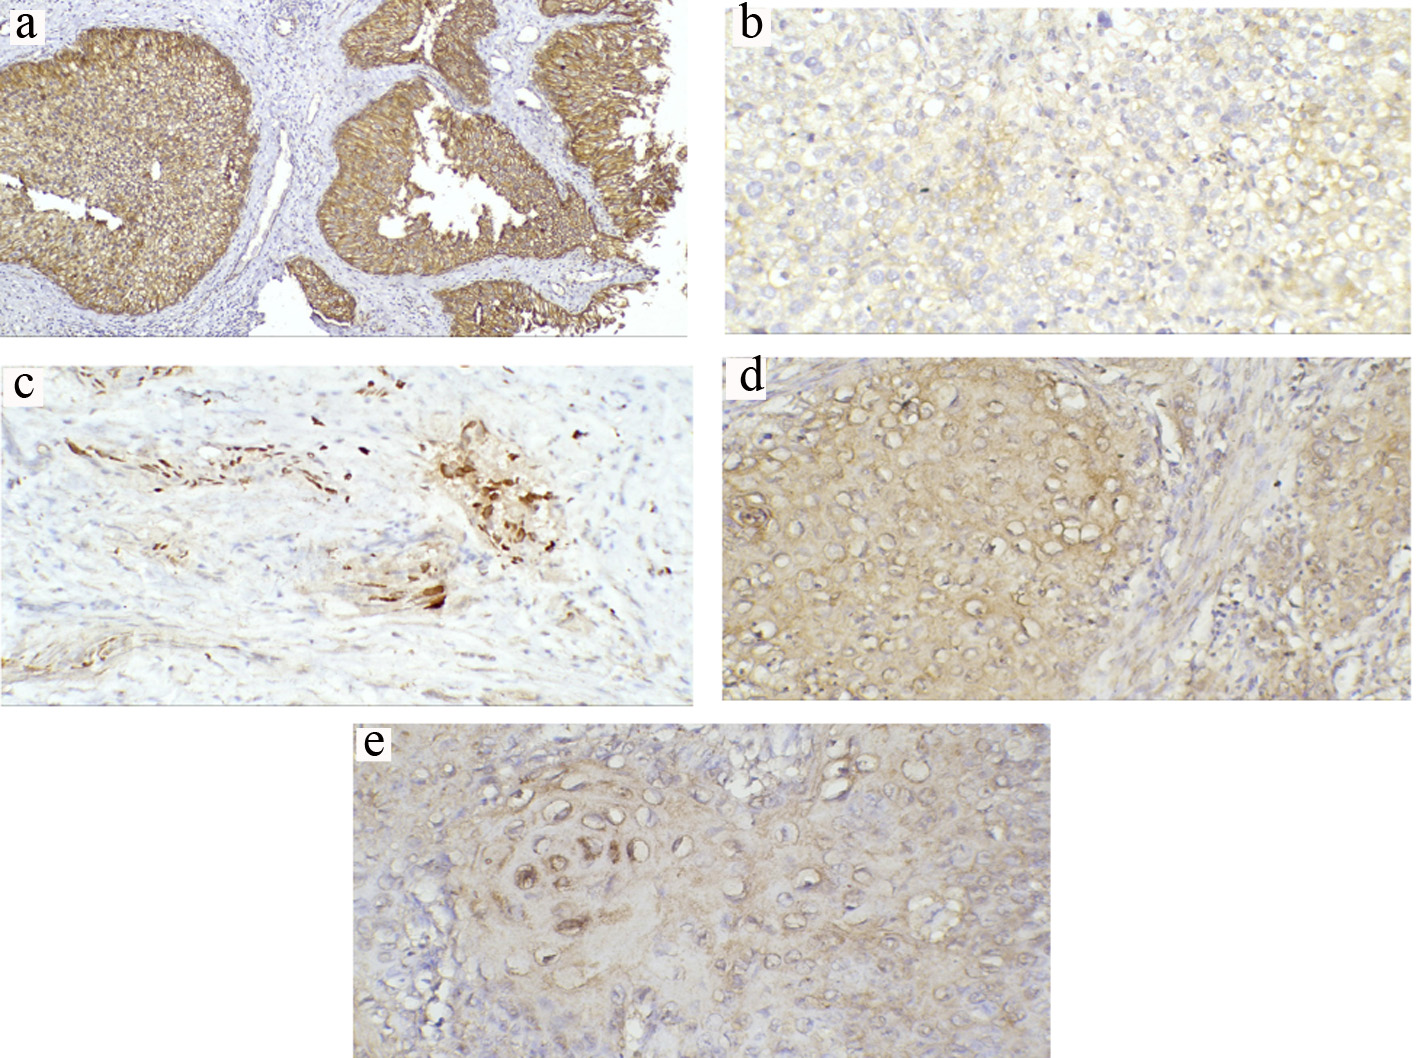
For TCC, positive nuclear ZEB1 expression was shown in 36.4% (n = 24) (Fig. 3a) with 44% recorded in high-grade tumors and 12% in low-grade tumors. Expression was significantly different between the two tumor grades (P = 0.023); however, distribution was almost equally observed in invasive (36%) and non-invasive subtypes (36.6%). There was no significant association between ZEB1 expression and tumor stage (P = 0.962) nor with LN metastasis (P = 0.46). Cytoplasmic immunoreactivity for ZEB2-positive samples was detected in 57.6% (n = 34) (Fig. 3b). There was a significant correlation between ZEB2-positive expression and tumor stage (P = 0.006) and LN metastasis (87% of node-positive tumor exhibited positive ZEB2 expression) (P < 0.001). On the other hand, there was no significant difference in the expression pattern of ZEB2 between low- and high-grade tumors (P = 0.647, Table 2).
 Click for large image | Figure 3. Representative immunohistochemical staining of ZEB1 and ZEB2 in TCCs and SCCs (a-d) (magnification × 200). (a) Positive ZEB1 nuclear expression in invasive TCC. (b) Positive ZEB2 cytoplasmic expression in invasive TCC. (c) Positive ZEB1 nuclear expression in invasive SCC. (d) Positive ZEB2 cytoplasmic expression in high-grade invasive SCC. TCC: transitional cell carcinoma; SCC: squamous cell carcinoma; ZEB: zinc-finger E-box-binding homeobox. |
For SCC, positive ZEB1expression was noticed in 28% (n = 7) (Fig. 3c). There was a significant correlation between positive expression and tumor grade (P = 0.04), stage (P = 0.04) and node-positive tumors (P = 0.001). Cytoplasmic immunoreactivity for ZEB2-positive samples was detected in 36% (n = 9) (Fig. 3d). There was a significant correlation between ZEB2-positive expression and tumor grade (P = 0.017), stage (P = 0.003) and LN metastasis (P = 0.012) (Table 3).
Association between clinicopathological data and p63 expression
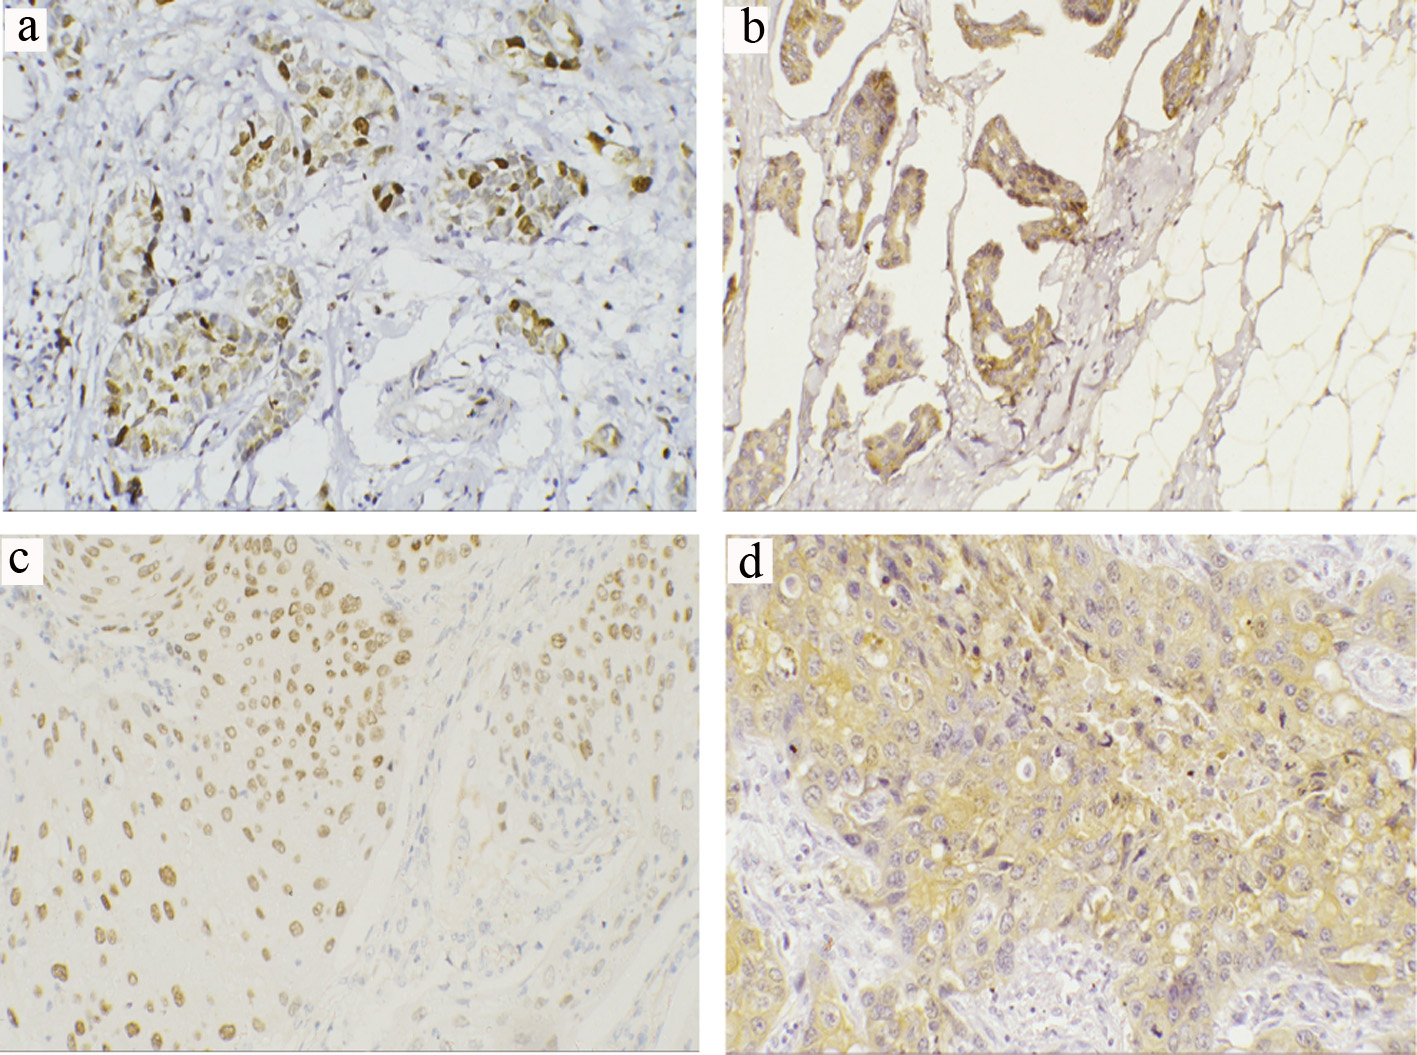
For TCC, 62% of positive expression was recorded in low-grade and 24% in high-grade tumors. There was a significant difference in expression between the two grades (P = 0.015). Regarding tumor stage, pTa and pT1 tumors were seen in 37.8% (n = 25); only 8% (n = 2) showed lost p63 expression, while 36% (n = 9) displayed weak staining and 56% (n = 14) with high (intense) homogenous staining (Fig. 4a). For ≥ T2 cases (n = 41), negative immunostaining was observed in 19.5% (n = 8), while weak staining was seen in 61% (n = 25) and few subsets of invasive TCC did retain significant intense p63 expression in 19.5% (n = 8) (Fig. 4b, c). A significant difference was noticed between the different tumor stages (pTa, pT1 and pT2 or more) (P = 0.009, Table 2).
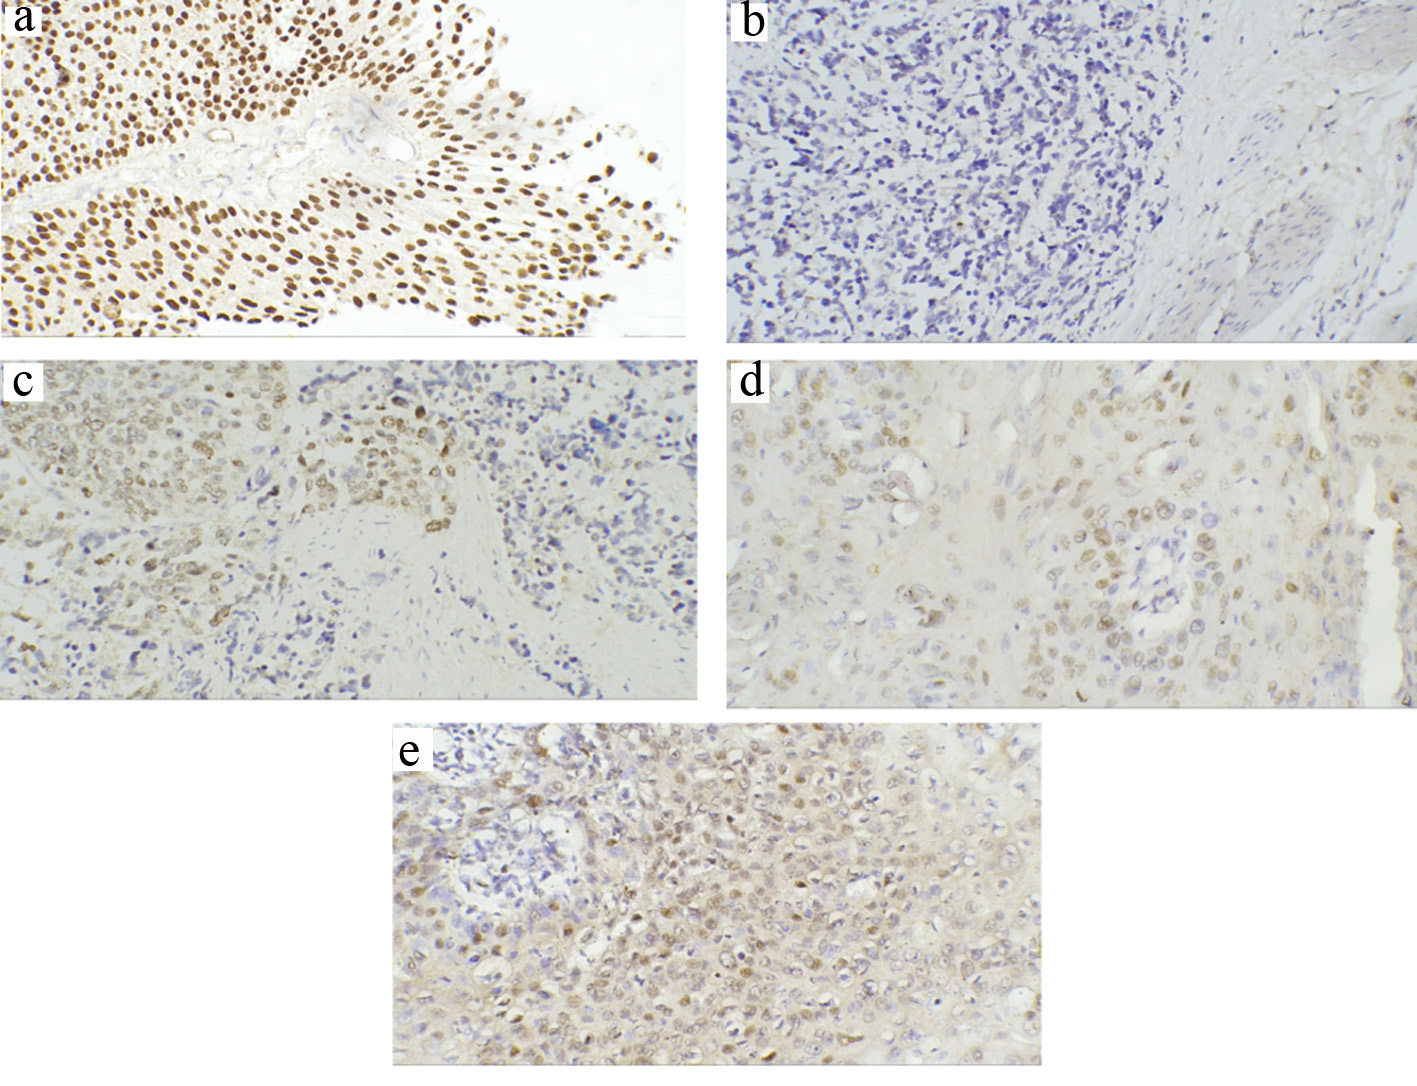 Click for large image | Figure 4. Representative immunohistochemical staining of p63 in TCCs and SCCs (a-e) (magnification × 200). (a) Strong staining of all cell layers in low-grade superficial TCC. (b) Loss of p63 expression in invasive TCC. (c) Some preserved positive p63 expression in invasive TCC. (d) Positive p63 in moderately differentiated SCC (G2) showing positivity in the cells of the basal layer. (e) Diffuse and high intense positivity for p63 in poorly differentiated SCC (G3). TCC: transitional cell carcinoma; SCC: squamous cell carcinoma. |
For SCC, 8% (n = 2) exhibited negative p63 expression, while 72% (n = 18) displayed weak staining and 20% (n = 5) showed strong homogenous staining. There were significant correlations between p63 expression and histological differentiation (P = 0.04), invasion depth (P = 0.04) and LN metastasis (P = 0.003) (Table 3). Negative p63 expression (1/1) was evident in grade I SCC case, while half of the patients with high grade (3/6) showed high (intense) positive expression (Fig. 4d, e). For tumor stage, none of the patients with non-invasive T1 stage exhibited strong staining, while 75% (n = 3) of invasive T3 stage showed high staining pattern. Further, there was a significant difference in p63 expression pattern between node-negative and node-positive tumors (P = 0.004).
A correlation analysis for different markers expression among TCC and SCC cases
In TCC cases, E-cadherin showed a significant moderate positive association with p63 expression (r = 0.512, P < 0.001), whereas it was inversely associated with ZEB1 (r = -0.481, P < 0.001), ZEB2 (r = -0.517, P < 0.001), and nuclear β-catenin (r = -0.757, P < 0.001) (Table 4). For SCC, E-cadherin expression was moderately to strongly inversely correlated with expression of ZEB1 (r = -0.7, P < 0.001), ZEB2 (r = -0.6, P < 0.001), and nuclear β-catenin (r = -0.8, P < 0.001). However, the association with p63 was weak and insignificant (r = -0.2, P = 0.2) (Table 5).
Click to view | Table 4. Correlation of E-Cadherin Expression With p63, ZEB1, ZEB2 and Nucleo-Cytoplasmic β-Catenin Expression in TCC Cases |
Click to view | Table 5. Correlation of E-cadherin Expression With p63, ZEB1, ZEB2 and Nucleo-Cytoplasmic β-Catenin Expression in SCC Cases |
Five-year overall survival (OS) rate
For TCC patients, the median follow-up was 55 months (range: 10 - 60). OS was 48.5%. Reduced E-cadherin expression was not significantly associated with the OS (P = 0.103). The lack of association was also true for high (intense) p63 expression (P = 0.09), nucleo-cytoplasmic/reduced membranous β-catenin expression (P = 0.8 and P = 0.284, respectively) as well as positive ZEB1 staining (P = 0.08). However, patients with ZEB2 positive tumors were more likely to die compared to those with negative ZEB2 (P = 0.024). The 5-year OS was 49.4 for patients with ZEB2-negative tumors compared to 34.9 in ZEB2-positive tumors (Fig. 5a-f). Interestingly, when confined to patients with MIBCs, an association was noticed between p63 high expression and poor OS; specifically, high (intense) p63 expression was associated with a significantly worse median OS of 19 months, whereas patients with lower levels of p63 had an improved median OS of 24 months (P < 0.001). Further, other markers did not show an association with OS (P > 0.05) (Fig. 5g).
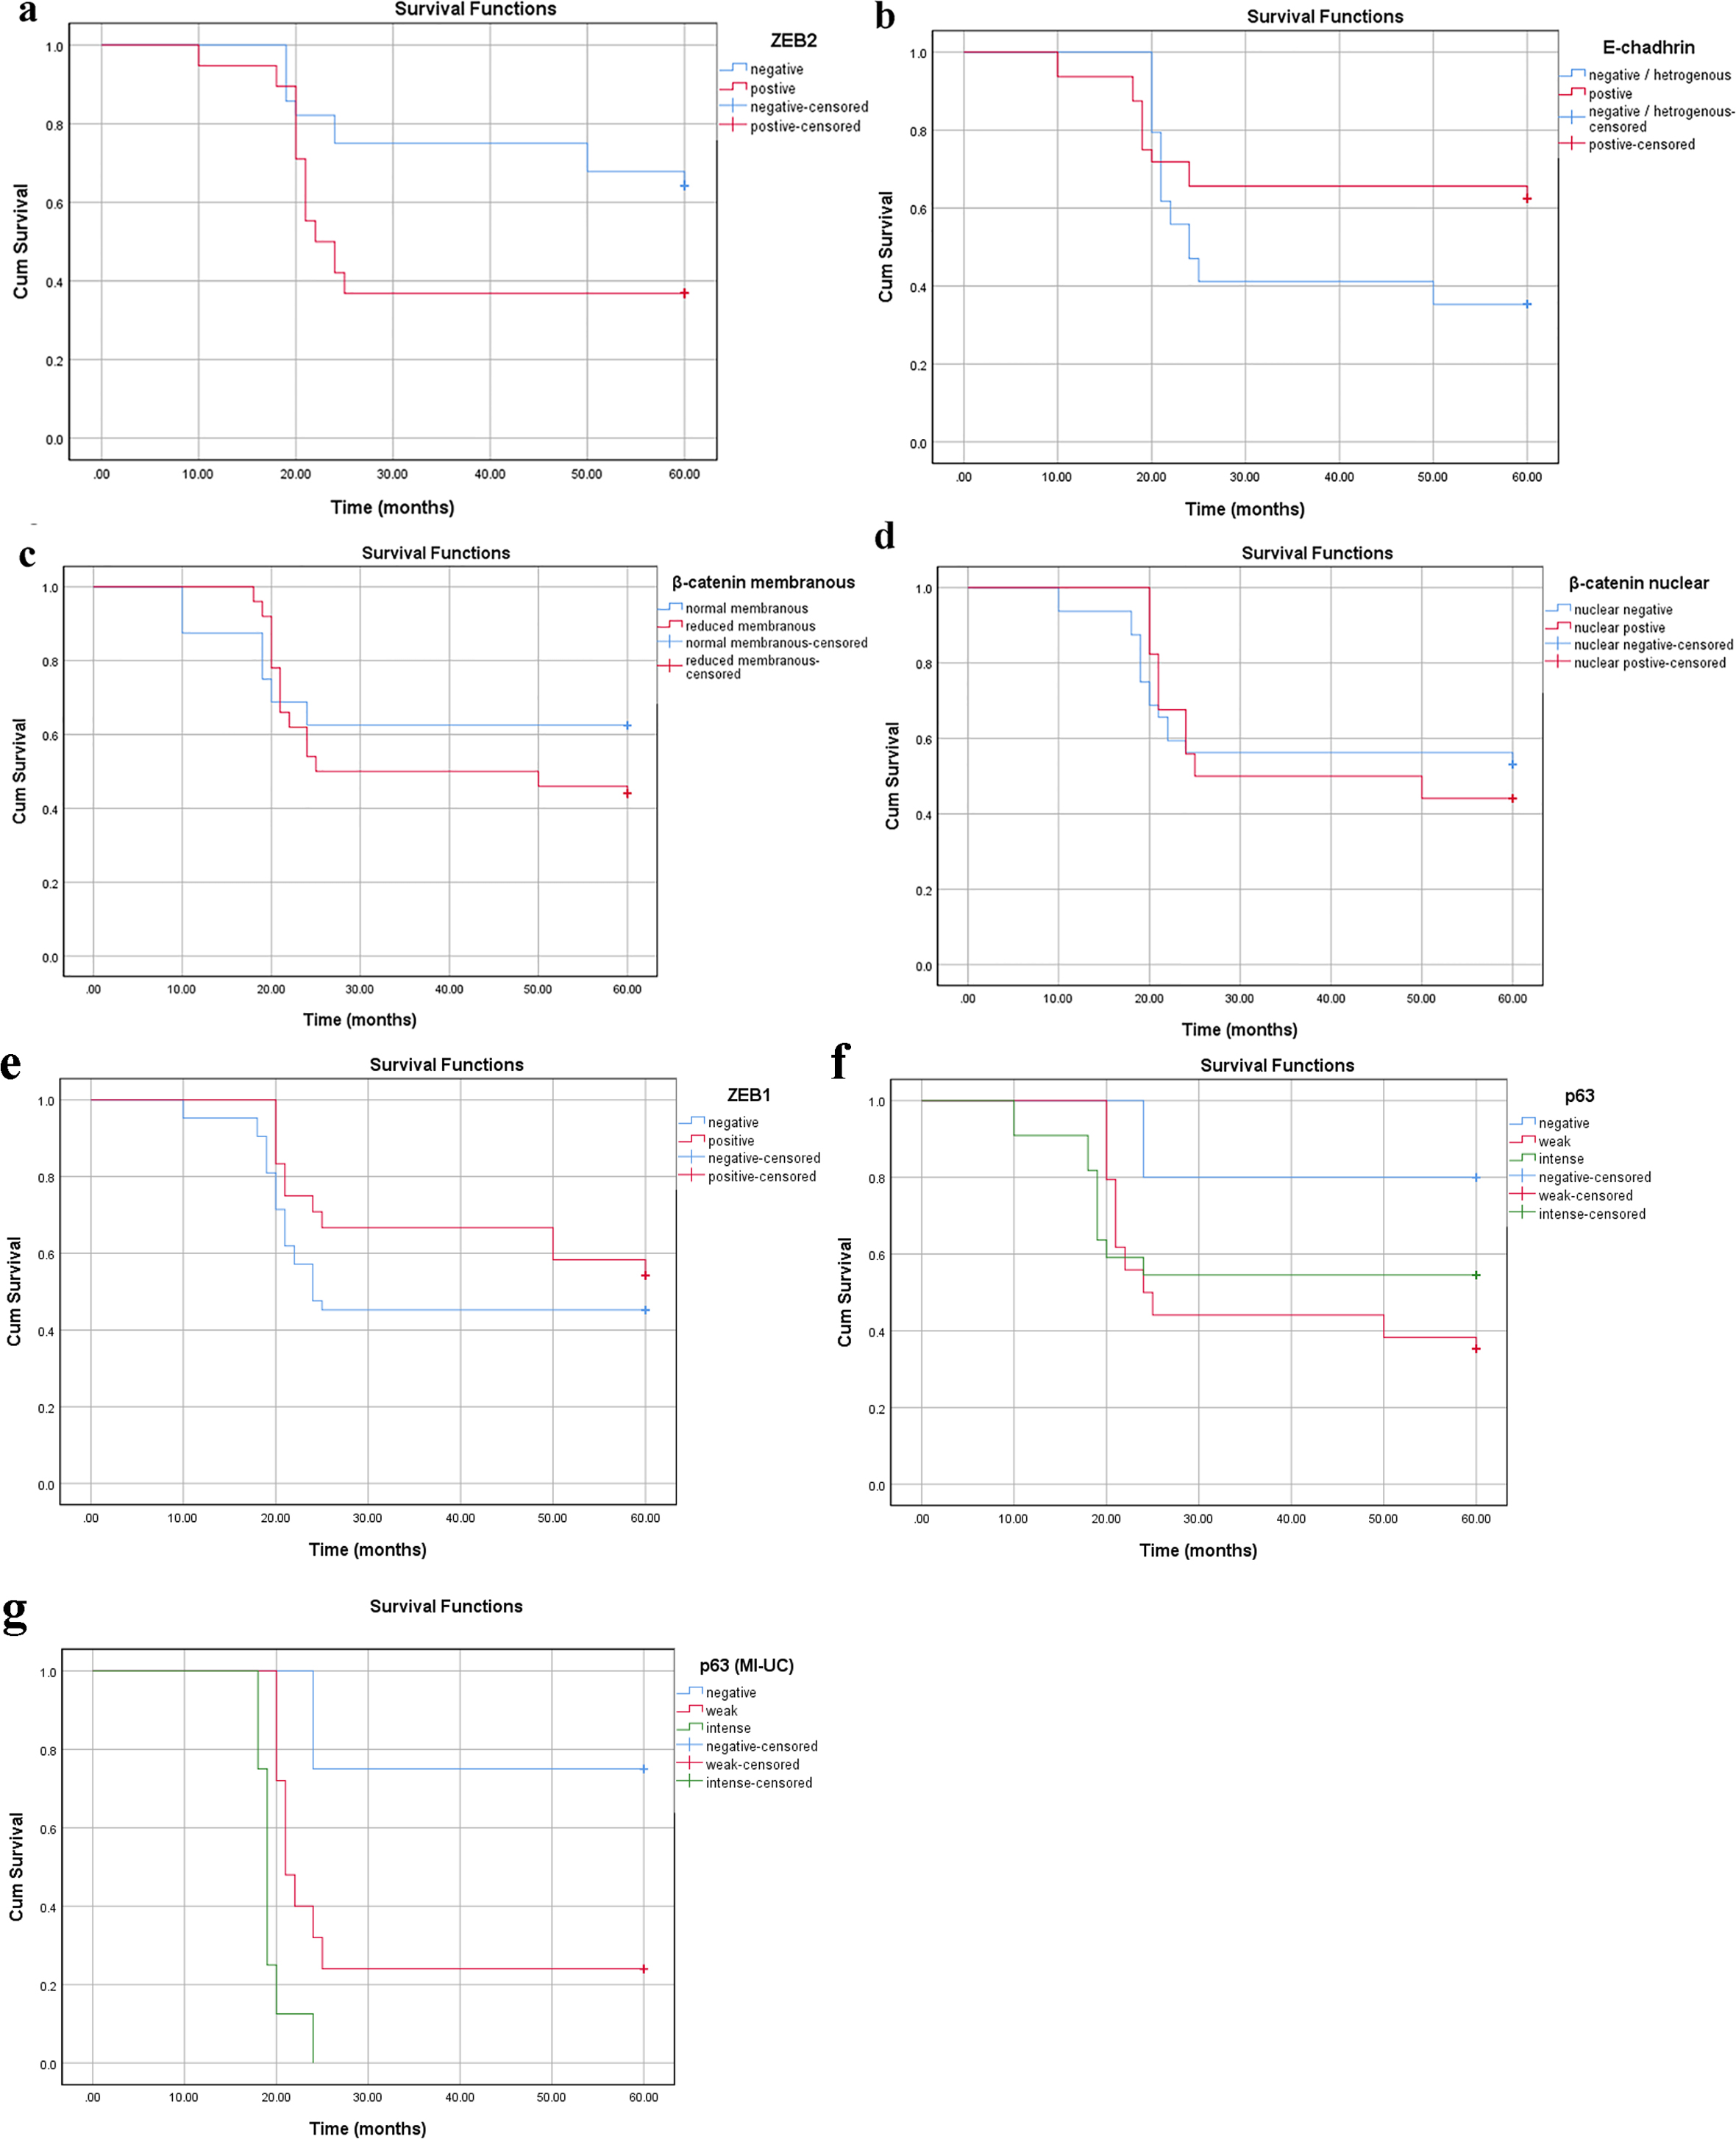 Click for large image | Figure 5. Survival analysis in the TCC group according to cumulative Kaplan-Meier methods (a-g). (a) ZEB2 cytoplasmic expression: negative group (blue) is associated with longer survival than positive group (red) (P = 0.024). (b-f) Reduced membranous E-cadherin, reduced membranous β-catenin, nuclear β-catenin, positive ZEB1, intense p63 expressions without significant correlations (P > 0.05). (g) Intense p63 expression is associated with poor survival in MI-UC (P < 0.001). MI-UC: urinary carcinoma with muscle invasion; TCC: transitional cell carcinoma; ZEB: zinc-finger E-box-binding homeobox. |
For SCC, the median follow-up was 51 months (range: 24 - 60). OS was 44% (n = 11). E-cadherin aberrant or absent immunoreactivity correlated with OS (P = 0.001, Fig. 6a). The OS was significantly poorer in patients with positive nucleo-cytoplasmic β-catenin/reduced membranous β-catenin, ZEB1 and ZEB2 positive cases as well patients with high (intense) p63 expression (P < 0.001, Fig. 6b-f).
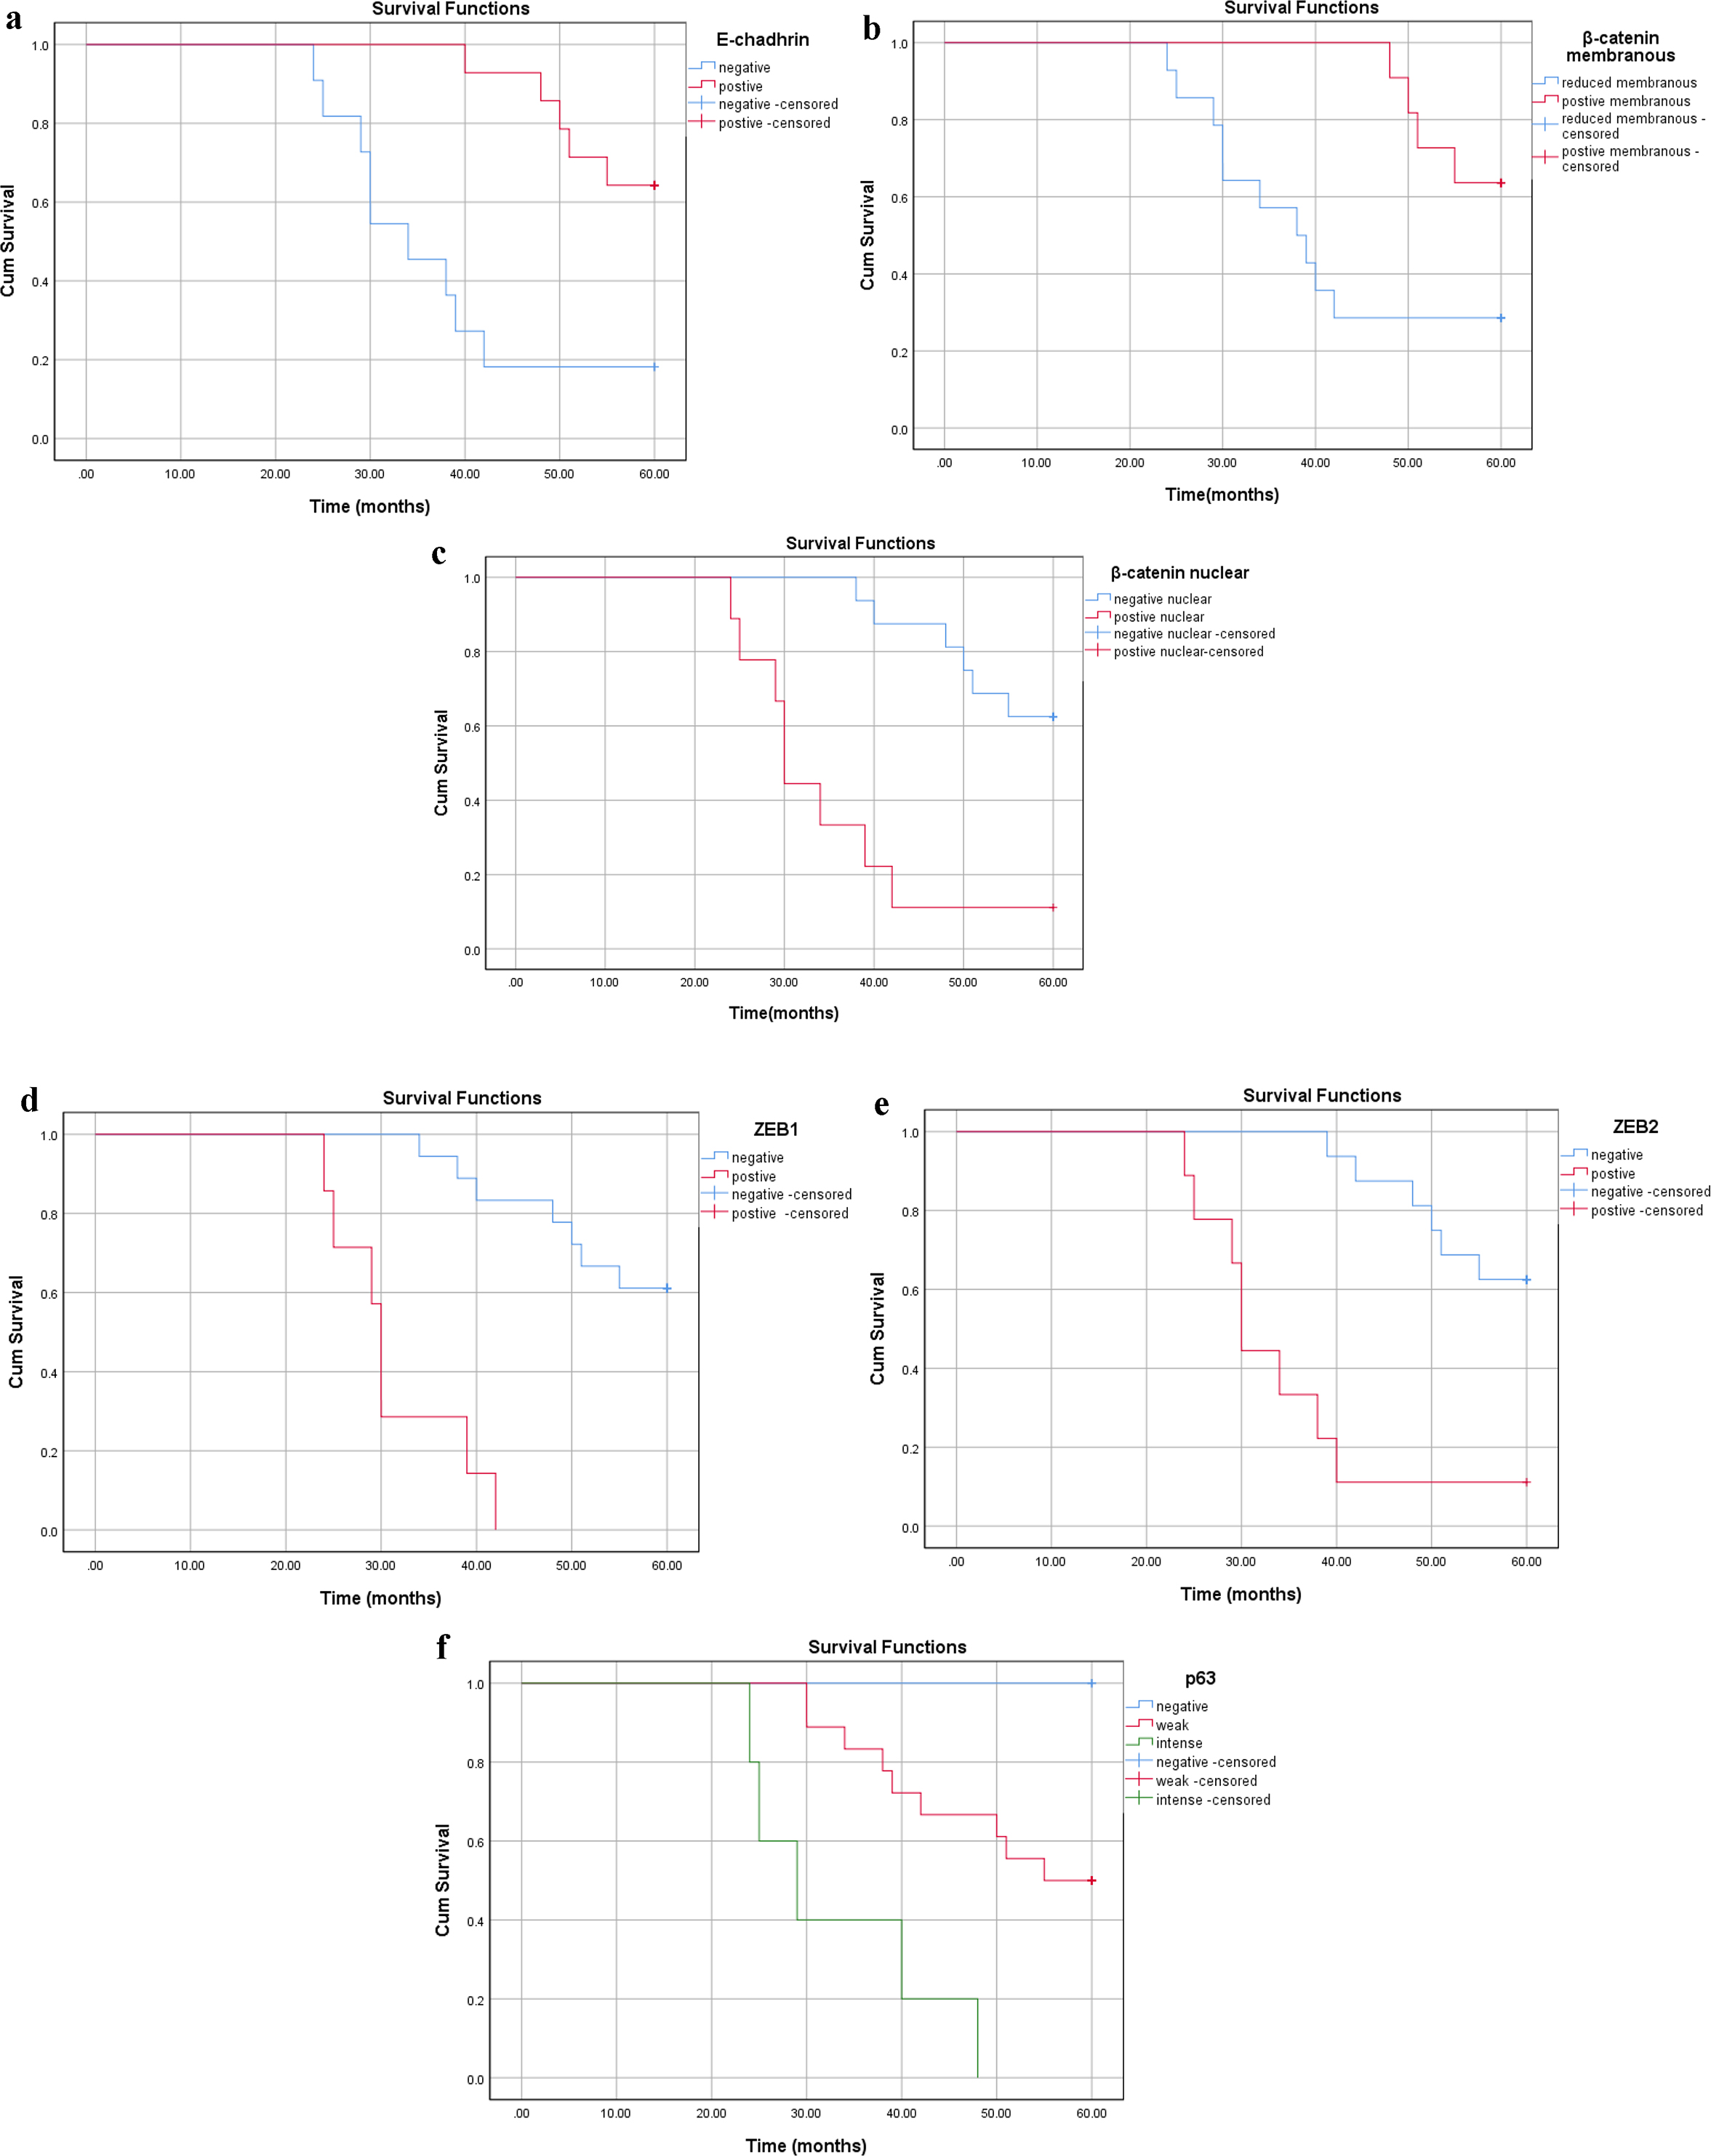 Click for large image | Figure 6. Survival analysis in the SCC group according to cumulative Kaplan-Meier methods (a-f). (a) Reduced membranous E-cadherin, (b) reduced membranous β-catenin, (c) nuclear β-catenin, (d) positive ZEB1 and (e) positive ZEB2 and (f) intense p63 expressions with significant correlations with shorter survival (P < 0.001). SCC: squamous cell carcinoma; ZEB: zinc-finger E-box-binding homeobox. |
| Discussion | ▴Top |
The spectrum of bladder tumors is broad and includes TCC, adenocarcinoma and SCC and other rare types. TCC is the most prevalent tumor representing 90% of bladder cancer cases and therefore has been studied most extensively [34]. SCC constitutes only a small percentage of all bladder tumors and therefore it has received less attention.
This study enrolled 66 patients (72.5%) with TCC and 25 patients (27.5%) with SCC. The distribution of carcinoma type in the studied sample is comparable to that reported earlier in Egypt [35]. The lower prevalence of SCC compared to TCC may be attributed to a reduction in schistosomal infection, increased cigarette smoking and occupation-related chemical exposure. In this study, the mean age at diagnosis for SCC cases was younger than that of TCC, which is an agreement with other work [36]. Male predominance was almost similar in both types of tumors to what has been previously reported [37, 38]. Also, the prevalence of bilharzial infection was significantly lower in TCC compared to SCC cases as previously reported in the literature [39]. The invasiveness of tumors was greater in SCC compared to TCC implying a more aggressive nature of SCC.
To the authors’ knowledge, this study is the first to investigate EMT markers (E-cadherin, β-catenin, p63, ZEB1 and ZEB2) expression in urothelial tumors of TCC and SCC variants. In this study, patients with TCC and SCC showed reduced E-cadherin expression in association with increased tumor grading, depth of invasion and LN metastasis. The TCC results are consistent with previous reports [31, 40, 41]. Similarly, current results are in line with that reported for SCC of non-bladder origin [42-46].
In TCC cases, E-cadherin was not associated with OS; meanwhile, conflicting results have been recorded [40, 41] regarding the relation of reduced E-cadherin expression and poor outcome. However, altered E-cadherin expression in SCC variant was associated with poor survival which is in an agreement with previous reports on SCC of non-bladder origin [42, 47].
β-Catenin plays a role in cell-to-cell adhesion and regulates urothelial homeostasis and carcinogenesis [48]. Our study showed that β-catenin reduced expression in patients with TCC. This reduction was significantly associated with muscle-invasive tumors and high tumor grade. This association agrees with that reported by previous studies [32, 49-53]. On the other hand, the evidence is lacking to support a difference in nuclear and membranous β-catenin expression pattern in node-negative and node-positive tumors, which could be attributed to the relatively small sample size enrolled in this study, which may have led to type II statistical error.
In SCC cases, our study demonstrated that both reduced β-catenin membranous expression and the presence of nuclear/cytoplasmic β-cat expression correlated with higher tumor grade; meanwhile reduced membranous expression was strongly associated with tumor stage. These findings are similar to those previously reported [45, 54, 55]. The loss of membranous expression and cytoplasmic and nuclear accumulation of β-catenin have been reported in different SCC tumors [56-58]. Further, this study showed a significant correlation between the presence of nuclear/cytoplasmic β-catenin expression and both node-positive tumors and OS, which is consistent with previous reports [2, 55, 59]. However, it should be noted that the correlation of these biomarkers with nodal metastasis and their diagnostic usefulness is still controversial [2, 55, 59-62].
For ZEB1 and ZEB2, which control EMT [16], nuclear ZEB1 expressions correlated only with tumor grade in TCC, which may imply its potential role in tumor differentiation. No evidence existed to suggest a correlation between this transcriptional repressor and tumor stage, LN metastasis and OS. Lee et al (2014) reported ZEB-1 immunoreactivity in association with high-grade urothelial carcinoma [33]. Although Kenney et al (2011) reported no association between ZEB1 positive expression and tumor grade, which contradicts with our results, yet the lack of association with nodal involvement, or OS is similar to the current results [63], so ZEB1 may participate only in tumor differentiation of TCC variant. On the contrary, for patients with SCC, ZEB1 was up-regulated in association with the differentiation status, tumor stage, LN metastasis as well as OS. Similar results have been reported in SCC of non-bladder origin [64, 65]. This was also true for undifferentiated endometrial carcinomas and high Gleason score prostate carcinomas [66, 67] as well as in metastatic tumors including LN metastasis and more invasive tumors [68, 69]. The association reported in SCC patients may suggest the association between nuclear ZEB1 expression and tumor phenotype aggressiveness and increased cell motility, and hence, their invasiveness. Such an association could predict a poorer prognosis of bladder SCC.
In contrast, this study showed ZEB2 positive expression in TCC that correlated with tumor stage, positive LN metastases and OS. These findings may imply a potential role for ZEB2 in TCC progression and invasion, and hence, its potential diagnostic value as a biomarker of biological aggressiveness. Sayan et al showed a ZEB2 positive expression in TCC in association with decreased OS, despite lacking for ZEB1-positive expression [70]. Meanwhile in SCC, ZEB2 increased expression correlated with all clinicopathological factors including histological differentiation, pathological stage, LN metastasis and OS, a relationship that was previously reported in gastric cancer, renal cell carcinoma, breast cancer, and oral SCC [22, 71-76].
p63 is selectively expressed in the basal cell or progenitor cell compartment of stratified epithelia including urothelium in human tissues [25, 77, 78]. Several studies have shown that p63 may play a key role in the differentiation of transitional epithelium [24, 78]. Two main isoforms (TAp63 and ΔNp63) with different functions are known. In normal bladder, ΔNp63 is absent or weakly expressed in these cells, whereas, in BCs, elevated expression of ΔNp63 was identified. It seems that ΔNp63 allows cells to respond to signals required for maturation [77, 79]. This may suggest the contribution of ΔNp63 to BC progression. A few authors proposed the use of p63 as a prognostic marker; however, it should be emphasized that variation in p63 expression and its role in bladder cancer development are still controversial [24, 51, 79, 80].
In this study, we reported diminished p63 expression in TCC as tumor grade increases. Further, weaker p63 expression was associated with increased tumor stage from superficial to invasive subtypes. These findings agreed with previous studies [24, 26, 51, 80, 81]. This suggests that, in the normal urothelium, p63 may play a growth-suppressive and differentiation-associated role, in which diminished p63 expression in TCCs may represent the loss of differentiation-associated, and therefore, growth-inhibitory p63 isoforms.
Considering the muscle-invasive subtypes, this study reports a high p63 expression in association with poor OS in patients with TCC. This is consistent with the findings of Choi et al who reported retention of this marker in primary bladder muscle-invasive tumors in association with poor outcome [81]. However, these results contradict with previous studies that associated the loss of p63 with shorter survival in patients with bladder cancer [51, 79]. However, the latter studies included patients with superficial cancers who usually have good survival, whereas the current study investigated more specific subgroups of patients with the muscle-invasive disease.
In patients with SCC, p63 overexpression was related to the degree of differentiation, stage and LN metastasis, all of which are signs of tumor aggressiveness. This could be attributed to the maintenance of the Np63 isoforms in squamous cancers leading to a greater immature cellular phenotype, thereby promoting tumor growth [82, 83]. Reports on SCC variant of bladder origin are lacking. Yet, the current findings are in agreements with the reported association of p63 expression and SCC differentiation in experimental animal models, head and neck squamous cell cancer, oral SCC, nasopharyngeal cancer, lung cancer, and epidermal tumor [83-89]. Our results are partly in agreement with Saghravanian et al who showed significantly high p63 expression in association with tumor stage and LN metastases in oral SCCs [90, 91]. In the current study, we demonstrated that a higher p63 (intense) expression was significantly associated with poor OS; it should be emphasized that the prognostic value of p63 expression is still controversial [90, 92-94]. This lack of consensus may be attributed to testing different p63 isoforms with different biologic properties and the small number of cases that were included in these studies.
Interestingly, our results demonstrate distinctive p63 expression patterns according to phenotypic variants of BCs. Decreased expression of DNp63 is a common feature in high-grade invasive urothelial carcinomas, indicating that urothelial carcinogenesis is distinct from the SCC transformation strongly associated with overexpression of DNp63 [51, 95]. Furthermore, it is interesting to emphasize that, as shown by our results, although this different pattern of p63 expression exists among two different variants of BC, it was clearly noticed that, the tumor cases with the highest p63 expression had the worst prognosis in both tumor groups. These results can highlight the important role of high p63 expression among different phenotypes of BC regardless of the different mechanism of action that differs from each tumor type. Also, these results can possibly advance our understanding of the initiating mechanisms, pathogenesis and prognosis of SCC variant versus TCC variant and also result in novel therapeutic target in cancer treatment.
Lastly, it has been shown that the clinical behavior of BC is difficult to predict based on classic histopathologic parameters alone [96]. So, to enhance the detection of tumor aggressiveness, use of biomarkers in conjunction with classic pathological prognostic factors such as stage, grade, LN involvement and lymphovascular invasion may improve prognosis and guide multimodal treatment approaches in the era of personalized medicine. More recently, another view of EMT became an important issue. The latest studies have demonstrated that numerous master regulators of EMT, including ZEB proteins, could have a crucial role in control of key cellular features, such as cell cycle, susceptibility to apoptosis and senescence. At early stages, ZEB proteins may potentially contribute to tumorigenesis via cooperation with activated oncogenes by overriding oncogene-induced senescence and apoptosis. They may control tumor cell dissemination via reversible EMT and help the formation of dormant metastases by causing reversible cell cycle arrest. At later stages, ZEB proteins have an effect on cancer cell properties by regulating expression of p53 family members such as p63, inducing resistance against anti-proliferative therapies [97-99].
In the light of previous findings, in our study we reported that positive ZEB2 expression which represents a poor prognostic feature in both TCC and SCC patients has shown a well-established anti-apoptotic activity independent of its effects on cell adhesion, thus suggesting that ZEB2 indicates a poor prognosis, especially in patients who will be treated with adjuvant postoperative radiotherapy/and or chemotherapy. Parallelly, as seen in our study, patients with ZEB1-positive bladder SCC exhibited worse survival outcomes. This can be explained on the basis of that ZEB1 expression protects cells from apoptosis and contributes to drug resistance in cancer cells, in part through regulation of p53/p63/ p73 family members. So, detection of ZEB1 and ZEB2 expression level in bladder tumors could facilitate prospective determining of their resistance (or sensitivity) to specific radiotherapy/chemotherapy treatments. Additionally, the inhibition of ZEB1, ZEB2 or its cofactors could be used to reverse drug resistance in cancer patients. Altogether, ZEB1 and ZEB2 may be used as an important prognostic and/or therapeutic cancer targets in the near future.
As regards to probable role of p63 in the new therapeutic options, pre-surgical (neoadjuvant) cisplatin-based neoadjuvant chemotherapy (NAC) is considered as the current standard-of-care for high-risk MIBC [100]. Although about 40% of patients with high-risk muscle-invasive bladder cancers can be cured with surgery and cisplatin-based chemotherapy, progression in patients with cisplatin-resistant disease is highly rapid and fatal [101]. Therefore, there is a great ought to discover new therapies that focus on the cisplatin-resistant subset of muscle-invasive tumors.
Previous studies have reported that p63 stimulates the expression of miR205 which has a well-established role in blocking EMT that has been implicated in drug resistance [6, 102]. So it seems that the effects of p63 in promoting sensitivity to antimitotic chemotherapy are also linked to its effects on EMT [103]. Interestingly, our results as well as these previous findings could indicate that for patients with the lethal, p63-positive muscle-invasive tumors who exhibited worse survival outcome, they could get most benefit from treatment with antimitotic chemotherapy.
To this end, we can emphasize that use of a panel of five markers, including E-cadherin, β-catenin, p63, ZEB1, and ZEB2 was suggestive to best represent variations in specific biomarker expression that may be associated with differences in patient outcomes or patient responsiveness to therapies. So these biomarkers may be used to guide the optimal treatment approach after radical cystectomy.
Conclusions
Patients with TCC of non-muscle-invasive subtypes showed increased expression of the epithelial markers E-cadherin, β-catenin and p63, while invasive tumors showed higher expression of mesenchymal markers including ZEB1 and ZEB2. Yet, a worse prognosis was seen in association with elevated p63 expression denoting an “epithelial” phenotype of invasive tumors. For patients with SCC, there was a reduction in E-cadherin and β-catenin positivity, elevated p63 expression and concomitant increased expression of ZEB1 and ZEB2. Poor prognosis was evident in association with elevated p63 expression. Taken together, in both TCC and SCC variants, EMT process is evident; however its molecular mechanism shows some variations, specifically this notably different p63 expression pattern among two carcinoma variants with the similar impact on prognosis. Thus, with available number investigated in this study, E-cadherin, β-catenin and p63, as well as ZEB1 and ZEB2 biomarkers levels may have significant prognostic value, and hence, may impact developing targeted therapy specifically for SCC variant. Future, prospective cohort studies with a larger sample size are required to confirm this conclusion.
Acknowledgments
None to declare.
Financial Disclosure
The authors received no financial support for the research, authorship, and/or publication of this article.
Conflict of Interest
The authors declared no potential conflict of interest with respect to the research, authorship, and/or publication of this article.
Informed Consent
Considering the characteristic of this study as a retrospective study performed on paraffin blocks, the written informed consents were waived in this study.
Author Contributions
RAM and EZIK contributed to collection of the samples, data statistics, manuscript writing and composition. AIA was responsible for data collection from medical records, clinical aspect of the project and the supervision and management of the project. All authors have contributed to and approved the final manuscript.
| References | ▴Top |
- Jemal A, Bray F, Center MM, Ferlay J, Ward E, Forman D. Global cancer statistics. CA Cancer J Clin. 2011;61(2):69-90.
doi pubmed - Muramaki M, Miyake H, Terakawa T, Kumano M, Sakai I, Fujisawa M. Expression profile of E-cadherin and N-cadherin in non-muscle-invasive bladder cancer as a novel predictor of intravesical recurrence following transurethral resection. Urol Oncol. 2012;30(2):161-166.
doi pubmed - Damrauer JS, Hoadley KA, Chism DD, Fan C, Tiganelli CJ, Wobker SE, Yeh JJ, et al. Intrinsic subtypes of high-grade bladder cancer reflect the hallmarks of breast cancer biology. Proc Natl Acad Sci U S A. 2014;111(8):3110-3115.
doi pubmed - Creighton CJ, Gibbons DL, Kurie JM. The role of epithelial-mesenchymal transition programming in invasion and metastasis: a clinical perspective. Cancer Manag Res. 2013;5:187-195.
doi pubmed - Lee JM, Dedhar S, Kalluri R, Thompson EW. The epithelial-mesenchymal transition: new insights in signaling, development, and disease. J Cell Biol. 2006;172(7):973-981.
doi pubmed - Kalluri R, Weinberg RA. The basics of epithelial-mesenchymal transition. J Clin Invest. 2009;119(6):1420-1428.
doi pubmed - Thiery JP. Epithelial-mesenchymal transitions in tumour progression. Nat Rev Cancer. 2002;2(6):442-454.
doi pubmed - Zeisberg M, Neilson EG. Biomarkers for epithelial-mesenchymal transitions. J Clin Invest. 2009;119(6):1429-1437.
doi pubmed - Peinado H, Olmeda D, Cano A. Snail, Zeb and bHLH factors in tumour progression: an alliance against the epithelial phenotype? Nat Rev Cancer. 2007;7(6):415-428.
doi pubmed - Nollet F, Kools P, van Roy F. Phylogenetic analysis of the cadherin superfamily allows identification of six major subfamilies besides several solitary members. J Mol Biol. 2000;299(3):551-57c2.
doi pubmed - Rangel MC, Karasawa H, Castro NP, Nagaoka T, Salomon DS, Bianco C. Role of Cripto-1 during epithelial-to-mesenchymal transition in development and cancer. Am J Pathol. 2012;180(6):2188-2200.
doi pubmed - Agiostratidou G, Hulit J, Phillips GR, Hazan RB. Differential cadherin expression: potential markers for epithelial to mesenchymal transformation during tumor progression. J Mammary Gland Biol Neoplasia. 2007;12(2-3):127-133.
doi pubmed - van der Horst G, Bos L, van der Pluijm G. Epithelial plasticity, cancer stem cells, and the tumor-supportive stroma in bladder carcinoma. Mol Cancer Res. 2012;10(8):995-1009.
doi pubmed - Jeanes A, Gottardi CJ, Yap AS. Cadherins and cancer: how does cadherin dysfunction promote tumor progression? Oncogene. 2008;27(55):6920-6929.
doi pubmed - Yun SJ, Kim WJ. Role of the epithelial-mesenchymal transition in bladder cancer: from prognosis to therapeutic target. Korean J Urol. 2013;54(10):645-650.
doi pubmed - Vandewalle C, Van Roy F, Berx G. The role of the ZEB family of transcription factors in development and disease. Cell Mol Life Sci. 2009;66(5):773-787.
doi pubmed - Browne G, Sayan AE, Tulchinsky E. ZEB proteins link cell motility with cell cycle control and cell survival in cancer. Cell Cycle. 2010;9(5):886-891.
doi pubmed - Chaffer CL, Brennan JP, Slavin JL, Blick T, Thompson EW, Williams ED. Mesenchymal-to-epithelial transition facilitates bladder cancer metastasis: role of fibroblast growth factor receptor-2. Cancer Res. 2006;66(23):11271-11278.
doi pubmed - Fassina A, Cappellesso R, Guzzardo V, Dalla Via L, Piccolo S, Ventura L, Fassan M. Epithelial-mesenchymal transition in malignant mesothelioma. Mod Pathol. 2012;25(1):86-99.
doi pubmed - Voulgari A, Pintzas A. Epithelial-mesenchymal transition in cancer metastasis: mechanisms, markers and strategies to overcome drug resistance in the clinic. Biochim Biophys Acta. 2009;1796(2):75-90.
doi pubmed - Castro Alves C, Rosivatz E, Schott C, Hollweck R, Becker I, Sarbia M, Carneiro F, et al. Slug is overexpressed in gastric carcinomas and may act synergistically with SIP1 and Snail in the down-regulation of E-cadherin. J Pathol. 2007;211(5):507-515.
doi pubmed - Rosivatz E, Becker I, Specht K, Fricke E, Luber B, Busch R, Hofler H, et al. Differential expression of the epithelial-mesenchymal transition regulators snail, SIP1, and twist in gastric cancer. Am J Pathol. 2002;161(5):1881-1891.
doi - Mejlvang J, Kriajevska M, Vandewalle C, Chernova T, Sayan AE, Berx G, Mellon JK, et al. Direct repression of cyclin D1 by SIP1 attenuates cell cycle progression in cells undergoing an epithelial mesenchymal transition. Mol Biol Cell. 2007;18(11):4615-4624.
doi pubmed - Urist MJ, Di Como CJ, Lu ML, Charytonowicz E, Verbel D, Crum CP, Ince TA, et al. Loss of p63 expression is associated with tumor progression in bladder cancer. Am J Pathol. 2002;161(4):1199-1206.
doi - Yang A, Schweitzer R, Sun D, Kaghad M, Walker N, Bronson RT, Tabin C, et al. p63 is essential for regenerative proliferation in limb, craniofacial and epithelial development. Nature. 1999;398(6729):714-718.
doi pubmed - Comperat E, Camparo P, Haus R, Chartier-Kastler E, Bart S, Delcourt A, Houlgatte A, et al. Immunohistochemical expression of p63, p53 and MIB-1 in urinary bladder carcinoma. A tissue microarray study of 158 cases. Virchows Arch. 2006;448(3):319-324.
doi pubmed - Adorno M, Cordenonsi M, Montagner M, Dupont S, Wong C, Hann B, Solari A, et al. A Mutant-p53/Smad complex opposes p63 to empower TGFbeta-induced metastasis. Cell. 2009;137(1):87-98.
doi pubmed - Benard J, Douc-Rasy S, Ahomadegbe JC. TP53 family members and human cancers. Hum Mutat. 2003;21(3):182-191.
doi pubmed - Edge S, Byrd D, Compton C, Fritz A, Greene F, Trotti A. Urinary bladder, AJCC cancer staging manual. New York: Springer; 2010.
- Eble JN, Sauter G, Epstein JI, Sesterhenn I. World Health Organization Classification of Tumours Pathology & Genetics. Tumors of the urinary system and male genital organs, IARC Press, Lyon. 2004.
- Jang TJ, Cha WH, Lee KS. Reciprocal correlation between the expression of cyclooxygenase-2 and E-cadherin in human bladder transitional cell carcinomas. Virchows Arch. 2010;457(3):319-328.
doi pubmed - Li Y, Zheng Y, Izumi K, Ishiguro H, Ye B, Li F, Miyamoto H. Androgen activates beta-catenin signaling in bladder cancer cells. Endocr Relat Cancer. 2013;20(3):293-304.
doi pubmed - Lee H, Jun SY, Lee YS, Lee HJ, Lee WS, Park CS. Expression of miRNAs and ZEB1 and ZEB2 correlates with histopathological grade in papillary urothelial tumors of the urinary bladder. Virchows Arch. 2014;464(2):213-220.
doi pubmed - Murta-Nascimento C, Schmitz-Drager BJ, Zeegers MP, Steineck G, Kogevinas M, Real FX, Malats N. Epidemiology of urinary bladder cancer: from tumor development to patient's death. World J Urol. 2007;25(3):285-295.
doi pubmed - Salem HK, Mahfouz S. Changing patterns (age, incidence, and pathologic types) of schistosoma-associated bladder cancer in Egypt in the past decade. Urology. 2012;79(2):379-383.
doi pubmed - Mokhtar N, Gouda I, Adel I. Cancer pathology registry 2003-2004 and time trend analysis. Journal of the Egyptian National Cancer Institute. 2007:281-281.
- Band PR, Le ND, MacArthur AC, Fang R, Gallagher RP. Identification of occupational cancer risks in British Columbia: a population-based case-control study of 1129 cases of bladder cancer. J Occup Environ Med. 2005;47(8):854-858.
doi pubmed - Khaled HM. Systemic management of bladder cancer in Egypt: revisited. J Egypt Natl Canc Inst. 2005;17(3):127-131.
- Gouda I, Mokhtar N, Bilal D, El-Bolkainy T, El-Bolkainy NM. Bilharziasis and bladder cancer: a time trend analysis of 9843 patients. J Egypt Natl Canc Inst. 2007;19(2):158-162.
- Clairotte A, Lascombe I, Fauconnet S, Mauny F, Felix S, Algros MP, Bittard H, et al. Expression of E-cadherin and alpha-, beta-, gamma-catenins in patients with bladder cancer: identification of gamma-catenin as a new prognostic marker of neoplastic progression in T1 superficial urothelial tumors. Am J Clin Pathol. 2006;125(1):119-126.
doi pubmed - Popov Z, Gil-Diez de Medina S, Lefrere-Belda MA, Hoznek A, Bastuji-Garin S, Abbou CC, Thiery JP, et al. Low E-cadherin expression in bladder cancer at the transcriptional and protein level provides prognostic information. Br J Cancer. 2000;83(2):209-214.
doi pubmed - Ahmed RA, Shawky Ael A, Hamed RH. Prognostic significance of cyclin D1 and E-cadherin expression in laryngeal squamous cell carcinoma. Pathol Oncol Res. 2014;20(3):625-633.
doi pubmed - Greco A, De Virgilio A, Rizzo MI, Pandolfi F, Rosati D, de Vincentiis M. The prognostic role of E-cadherin and beta-catenin overexpression in laryngeal squamous cell carcinoma. Laryngoscope. 2016;126(4):E148-155.
doi pubmed - Sasaki K, Natsugoe S, Ishigami S, Matsumoto M, Okumura H, Setoyama T, Uchikado Y, et al. Significance of Twist expression and its association with E-cadherin in esophageal squamous cell carcinoma. J Exp Clin Cancer Res. 2009;28:158.
doi pubmed - Soares MQ, Mendonca JA, Morais MO, Leles CR, Batista AC, Mendonca EF. E-cadherin, beta-catenin, and alpha2beta1 and alpha3beta1 integrin expression in primary oral squamous cell carcinoma and its regional metastasis. Histol Histopathol. 2015;30(10):1213-1222.
- Zhou J, Tao D, Xu Q, Gao Z, Tang D. Expression of E-cadherin and vimentin in oral squamous cell carcinoma. Int J Clin Exp Pathol. 2015;8(3):3150-3154.
- Cappellesso R, Marioni G, Crescenzi M, Giacomelli L, Guzzardo V, Mussato A, Staffieri A, et al. The prognostic role of the epithelial-mesenchymal transition markers E-cadherin and Slug in laryngeal squamous cell carcinoma. Histopathology. 2015;67(4):491-500.
doi pubmed - Urakami S, Shiina H, Enokida H, Kawakami T, Tokizane T, Ogishima T, Tanaka Y, et al. Epigenetic inactivation of Wnt inhibitory factor-1 plays an important role in bladder cancer through aberrant canonical Wnt/beta-catenin signaling pathway. Clin Cancer Res. 2006;12(2):383-391.
doi pubmed - Bilim V, Kawasaki T, Katagiri A, Wakatsuki S, Takahashi K, Tomita Y. Altered expression of beta-catenin in renal cell cancer and transitional cell cancer with the absence of beta-catenin gene mutations. Clin Cancer Res. 2000;6(2):460-466.
- Kastritis E, Murray S, Kyriakou F, Horti M, Tamvakis N, Kavantzas N, Patsouris ES, et al. Somatic mutations of adenomatous polyposis coli gene and nuclear b-catenin accumulation have prognostic significance in invasive urothelial carcinomas: evidence for Wnt pathway implication. Int J Cancer. 2009;124(1):103-108.
doi pubmed - Koga F, Kawakami S, Kumagai J, Takizawa T, Ando N, Arai G, Kageyama Y, et al. Impaired Delta Np63 expression associates with reduced beta-catenin and aggressive phenotypes of urothelial neoplasms. Br J Cancer. 2003;88(5):740-747.
doi pubmed - Senol S, Yildirim A, Ceyran B, Uruc F, Zemheri E, Ozkanli S, Akalin I, et al. Prognostic significance of survivin, beta-catenin and p53 expression in urothelial carcinoma. Bosn J Basic Med Sci. 2015;15(4):7-14.
doi pubmed - Zhu X, Kanai Y, Saito A, Kondo Y, Hirohashi S. Aberrant expression of beta-catenin and mutation of exon 3 of the beta-catenin gene in renal and urothelial carcinomas. Pathol Int. 2000;50(12):945-952.
doi pubmed - Angadi PV, Patil PV, Angadi V, Mane D, Shekar S, Hallikerimath S, Kale AD, et al. Immunoexpression of epithelial mesenchymal transition Proteins E-Cadherin, beta-Catenin, and N-Cadherin in oral squamous cell carcinoma. Int J Surg Pathol. 2016;24(8):696-703.
doi pubmed - Kaur J, Sawhney M, DattaGupta S, Shukla NK, Srivastava A, Walfish PG, Ralhan R. Clinical significance of altered expression of beta-catenin and E-cadherin in oral dysplasia and cancer: potential link with ALCAM expression. PLoS One. 2013;8(6):e67361.
doi pubmed - Cai ZG, Shi XJ, Gao Y, Wei MJ, Wang CY, Yu GY. beta-catenin expression pattern in primary oral squamous cell carcinoma. Chin Med J (Engl). 2008;121(19):1866-1870.
doi - Freitas Rde A, Silveira EJ, Silveira JP, Silva FM, Amorim RF. Correlation of beta-catenin expresssion and metastasis in tongue squamous cell carcinoma. Acta Cir Bras. 2010;25(6):513-517.
doi pubmed - Gao S, Eiberg H, Krogdahl A, Liu CJ, Sorensen JA. Cytoplasmic expression of E-cadherin and beta-Catenin correlated with LOH and hypermethylation of the APC gene in oral squamous cell carcinomas. J Oral Pathol Med. 2005;34(2):116-119.
doi pubmed - Zhong LP, Li J, Zhang CP, Zhu HG, Sun J, Zhang ZY. Expression of E-cadherin in cervical lymph nodes from primary oral squamous cell carcinoma patients. Arch Oral Biol. 2007;52(8):740-747.
doi pubmed - Bankfalvi A, Krassort M, Vegh A, Felszeghy E, Piffko J. Deranged expression of the E-cadherin/beta-catenin complex and the epidermal growth factor receptor in the clinical evolution and progression of oral squamous cell carcinomas. J Oral Pathol Med. 2002;31(8):450-457.
doi pubmed - Gonzalez-Moles MA, Ruiz-Avila I, Gil-Montoya JA, Plaza-Campillo J, Scully C. beta-catenin in oral cancer: an update on current knowledge. Oral Oncol. 2014;50(9):818-824.
doi pubmed - Mahomed F, Altini M, Meer S. Altered E-cadherin/beta-catenin expression in oral squamous carcinoma with and without nodal metastasis. Oral Dis. 2007;13(4):386-392.
doi pubmed - Kenney PA, Wszolek MF, Rieger-Christ KM, Neto BS, Gould JJ, Harty NJ, Mosquera JM, et al. Novel ZEB1 expression in bladder tumorigenesis. BJU Int. 2011;107(4):656-663.
doi pubmed - Ma Y, Zheng X, Zhou J, Zhang Y, Chen K. ZEB1 promotes the progression and metastasis of cervical squamous cell carcinoma via the promotion of epithelial-mesenchymal transition. Int J Clin Exp Pathol. 2015;8(9):11258-11267.
- Yao X, Sun S, Zhou X, Zhang Q, Guo W, Zhang L. Clinicopathological significance of ZEB-1 and E-cadherin proteins in patients with oral cavity squamous cell carcinoma. Onco Targets Ther. 2017;10:781-790.
doi pubmed - Graham TR, Zhau HE, Odero-Marah VA, Osunkoya AO, Kimbro KS, Tighiouart M, Liu T, et al. Insulin-like growth factor-I-dependent up-regulation of ZEB1 drives epithelial-to-mesenchymal transition in human prostate cancer cells. Cancer Res. 2008;68(7):2479-2488.
doi pubmed - Romero-Perez L, Lopez-Garcia MA, Diaz-Martin J, Biscuola M, Castilla MA, Tafe LJ, Garg K, et al. ZEB1 overexpression associated with E-cadherin and microRNA-200 downregulation is characteristic of undifferentiated endometrial carcinoma. Mod Pathol. 2013;26(11):1514-1524.
doi pubmed - Liu Y, Zhang N, Wang Y, Xu M, Liu N, Pang X, Cao J, et al. Zinc finger E-box binding homeobox 1 promotes invasion and bone metastasis of small cell lung cancer in vitro and in vivo. Cancer Sci. 2012;103(8):1420-1428.
doi pubmed - Shen A, Zhang Y, Yang H, Xu R, Huang G. Overexpression of ZEB1 relates to metastasis and invasion in osteosarcoma. J Surg Oncol. 2012;105(8):830-834.
doi pubmed - Sayan AE, Griffiths TR, Pal R, Browne GJ, Ruddick A, Yagci T, Edwards R, et al. SIP1 protein protects cells from DNA damage-induced apoptosis and has independent prognostic value in bladder cancer. Proc Natl Acad Sci U S A. 2009;106(35):14884-14889.
doi pubmed - Fang Y, Wei J, Cao J, Zhao H, Liao B, Qiu S, Wang D, et al. Protein expression of ZEB2 in renal cell carcinoma and its prognostic significance in patient survival. PLoS One. 2013;8(5):e62558.
doi pubmed - Karihtala P, Auvinen P, Kauppila S, Haapasaari KM, Jukkola-Vuorinen A, Soini Y. Vimentin, zeb1 and Sip1 are up-regulated in triple-negative and basal-like breast cancers: association with an aggressive tumour phenotype. Breast Cancer Res Treat. 2013;138(1):81-90.
doi pubmed - Maeda G, Chiba T, Okazaki M, Satoh T, Taya Y, Aoba T, Kato K, et al. Expression of SIP1 in oral squamous cell carcinomas: implications for E-cadherin expression and tumor progression. Int J Oncol. 2005;27(6):1535-1541.
- Okugawa Y, Inoue Y, Tanaka K, Kawamura M, Saigusa S, Toiyama Y, Ohi M, et al. Smad interacting protein 1 (SIP1) is associated with peritoneal carcinomatosis in intestinal type gastric cancer. Clin Exp Metastasis. 2013;30(4):417-429.
doi pubmed - Sakamoto K, Imanishi Y, Tomita T, Shimoda M, Kameyama K, Shibata K, Sakai N, et al. Overexpression of SIP1 and downregulation of E-cadherin predict delayed neck metastasis in stage I/II oral tongue squamous cell carcinoma after partial glossectomy. Ann Surg Oncol. 2012;19(2):612-619.
doi pubmed - Yoshida R, Morita M, Shoji F, Nakashima Y, Miura N, Yoshinaga K, Koga T, et al. Clinical significance of SIP1 and E-cadherin in patients with esophageal squamous cell carcinoma. Ann Surg Oncol. 2015;22(8):2608-2614.
doi pubmed - Di Como CJ, Urist MJ, Babayan I, Drobnjak M, Hedvat CV, Teruya-Feldstein J, Pohar K, et al. p63 expression profiles in human normal and tumor tissues. Clin Cancer Res. 2002;8(2):494-501.
- Yang A, Kaghad M, Wang Y, Gillett E, Fleming MD, Dotsch V, Andrews NC, et al. p63, a p53 homolog at 3q27-29, encodes multiple products with transactivating, death-inducing, and dominant-negative activities. Mol Cell. 1998;2(3):305-316.
doi - Park BJ, Lee SJ, Kim JI, Lee SJ, Lee CH, Chang SG, Park JH, et al. Frequent alteration of p63 expression in human primary bladder carcinomas. Cancer Res. 2000;60(13):3370-3374.
- Langner C, Ratschek M, Tsybrovskyy O, Schips L, Zigeuner R. P63 immunoreactivity distinguishes upper urinary tract transitional-cell carcinoma and renal-cell carcinoma even in poorly differentiated tumors. J Histochem Cytochem. 2003;51(8):1097-1099.
doi pubmed - Choi W, Shah JB, Tran M, Svatek R, Marquis L, Lee IL, Yu D, et al. p63 expression defines a lethal subset of muscle-invasive bladder cancers. PLoS One. 2012;7(1):e30206.
doi pubmed - Graziano V, De Laurenzi V. Role of p63 in cancer development. Biochim Biophys Acta. 2011;1816(1):57-66.
doi pubmed - Tsujita-Kyutoku M, Kiuchi K, Danbara N, Yuri T, Senzaki H, Tsubura A. p63 expression in normal human epidermis and epidermal appendages and their tumors. J Cutan Pathol. 2003;30(1):11-17.
doi pubmed - Chen YK, Hsue SS, Lin LM. Immunohistochemical demonstration of p63 in DMBA-induced hamster buccal pouch squamous cell carcinogenesis. Oral Dis. 2003;9(5):235-240.
doi pubmed - Choi HR, Batsakis JG, Zhan F, Sturgis E, Luna MA, El-Naggar AK. Differential expression of p53 gene family members p63 and p73 in head and neck squamous tumorigenesis. Hum Pathol. 2002;33(2):158-164.
doi pubmed - Crook T, Nicholls JM, Brooks L, O'Nions J, Allday MJ. High level expression of deltaN-p63: a mechanism for the inactivation of p53 in undifferentiated nasopharyngeal carcinoma (NPC)? Oncogene. 2000;19(30):3439-3444.
doi pubmed - Patel SB, Manjunatha BS, Shah V, Soni N, Sutariya R. Immunohistochemical evaluation of p63 and cyclin D1 in oral squamous cell carcinoma and leukoplakia. J Korean Assoc Oral Maxillofac Surg. 2017;43(5):324-330.
doi pubmed - Pruneri G, Pignataro L, Manzotti M, Carboni N, Ronchetti D, Neri A, Cesana BM, et al. p63 in laryngeal squamous cell carcinoma: evidence for a role of TA-p63 down-regulation in tumorigenesis and lack of prognostic implications of p63 immunoreactivity. Lab Invest. 2002;82(10):1327-1334.
doi pubmed - Reis-Filho JS, Torio B, Albergaria A, Schmitt FC. p63 expression in normal skin and usual cutaneous carcinomas. J Cutan Pathol. 2002;29(9):517-523.
doi pubmed - Saghravanian N, Anvari K, Ghazi N, Memar B, Shahsavari M, Aghaee MA. Expression of p63 and CD44 in oral squamous cell carcinoma and correlation with clinicopathological parameters. Arch Oral Biol. 2017;82:160-165.
doi pubmed - Foschini MP, Cocchi R, Morandi L, Marucci G, Pennesi MG, Righi A, Tosi AL, et al. E-cadherin loss and Delta Np73L expression in oral squamous cell carcinomas showing aggressive behavior. Head Neck. 2008;30(11):1475-1482.
doi pubmed - de Oliveira LR, Ribeiro-Silva A, Zucoloto S. Prognostic impact of p53 and p63 immunoexpression in oral squamous cell carcinoma. J Oral Pathol Med. 2007;36(4):191-197.
doi pubmed - Lo Muzio L, Campisi G, Farina A, Rubini C, Pastore L, Giannone N, Colella G, et al. Effect of p63 expression on survival in oral squamous cell carcinoma. Cancer Invest. 2007;25(6):464-469.
doi pubmed - Oliveira LR, Ribeiro-Silva A. Prognostic significance of immunohistochemical biomarkers in oral squamous cell carcinoma. Int J Oral Maxillofac Surg. 2011;40(3):298-307.
doi pubmed - Hibi K, Trink B, Patturajan M, Westra WH, Caballero OL, Hill DE, Ratovitski EA, et al. AIS is an oncogene amplified in squamous cell carcinoma. Proc Natl Acad Sci U S A. 2000;97(10):5462-5467.
doi pubmed - Martin JW, Carballido EM, Ahmed A, Farhan B, Dutta R, Smith C, Youssef RF. Squamous cell carcinoma of the urinary bladder: Systematic review of clinical characteristics and therapeutic approaches. Arab J Urol. 2016;14(3):183-191.
doi pubmed - Husemann Y, Geigl JB, Schubert F, Musiani P, Meyer M, Burghart E, Forni G, et al. Systemic spread is an early step in breast cancer. Cancer Cell. 2008;13(1):58-68.
doi pubmed - Klein CA. Parallel progression of primary tumours and metastases. Nat Rev Cancer. 2009;9(4):302-312.
doi pubmed - Schmidt-Kittler O, Ragg T, Daskalakis A, Granzow M, Ahr A, Blankenstein TJ, Kaufmann M, et al. From latent disseminated cells to overt metastasis: genetic analysis of systemic breast cancer progression. Proc Natl Acad Sci U S A. 2003;100(13):7737-7742.
doi pubmed - Shah JB, McConkey DJ, Dinney CP. New strategies in muscle-invasive bladder cancer: on the road to personalized medicine. Clin Cancer Res. 2011;17(9):2608-2612.
doi pubmed - Dinney CP, McConkey DJ, Millikan RE, Wu X, Bar-Eli M, Adam L, Kamat AM, et al. Focus on bladder cancer. Cancer Cell. 2004;6(2):111-116.
doi pubmed - Gregory PA, Bert AG, Paterson EL, Barry SC, Tsykin A, Farshid G, Vadas MA, et al. The miR-200 family and miR-205 regulate epithelial to mesenchymal transition by targeting ZEB1 and SIP1. Nat Cell Biol. 2008;10(5):593-601.
doi pubmed - Marquis L, Tran M, Choi W, Lee IL, Huszar D, Siefker-Radtke A, Dinney C, et al. p63 expression correlates with sensitivity to the Eg5 inhibitor ZD4877 in bladder cancer cells. Cancer Biol Ther. 2012;13(7):477-486.
doi pubmed
This article is distributed under the terms of the Creative Commons Attribution Non-Commercial 4.0 International License, which permits unrestricted non-commercial use, distribution, and reproduction in any medium, provided the original work is properly cited.
World Journal of Oncology is published by Elmer Press Inc.