

| World Journal of Oncology, ISSN 1920-4531 print, 1920-454X online, Open Access |
| Article copyright, the authors; Journal compilation copyright, World J Oncol and Elmer Press Inc |
| Journal website https://www.wjon.org |
Original Article
Volume 15, Number 1, February 2024, pages 58-71

Radiomics of Preoperative Multi-Sequence Magnetic Resonance Imaging Can Improve the Predictive Performance of Microvascular Invasion in Hepatocellular Carcinoma
Wan Min Liua, e, Xing Yu Zhaoa, e, Meng Ting Gua, Kai Rong Songb, Wei Zhengb, Hui Yub, Hui Lin Chenc, Xiao Wen Xua, Xiang Zhoua, Ai E Liud, Ning Yang Jiab, f, Pei Jun Wanga, f
aDepartment of Radiology, Tongji Hospital, School of Medicine, Tongji University, Shanghai, China
bDepartment of Radiology, Eastern Hepatobiliary Surgery Hospital, The Third Affiliated Hospital of Shanghai Naval Military Medical University, Shanghai, China
cSchool of Health Science and Engineering, University of Shanghai for Science and Technology, Shanghai, China
dDepartment of Research Center, Shanghai United Imaging Intelligence Co., Ltd, Shanghai, China
eThese authors contributed equally to this work.
fCorresponding Author: Pei Jun Wang, Department of Radiology, Tongji Hospital, School of Medicine, Tongji University, Shanghai, China; Ning Yang Jia, Department of Radiology, Eastern Hepatobiliary Surgery Hospital, The Third Affiliated Hospital of Shanghai Naval Military Medical University, Shanghai, China
Manuscript submitted September 19, 2023, accepted November 15, 2023, published online December 9, 2023
Short title: Radiomics in Predicting MVI of HCC
doi: https://doi.org/10.14740/wjon1731
| Abstract | ▴Top |
Background: The aim of the study is to demonstrate that radiomics of preoperative multi-sequence magnetic resonance imaging (MRI) can indeed improve the predictive performance of microvascular invasion (MVI) in hepatocellular carcinoma (HCC).
Methods: A total of 206 patients with pathologically confirmed HCC who underwent preoperative enhanced MRI were retrospectively recruited. Univariate and multivariate logistic regression analysis identified the independent clinicoradiologic predictors of MVI present and constituted the clinicoradiologic model. Recursive feature elimination (RFE) was applied to select radiomics features (extracted from six sequence images) and constructed the radiomics model. Clinicoradiologic model plus radiomics model formed the clinicoradiomics model. Five-fold cross-validation was used to validate the three models. Discrimination, calibration, and clinical utility were used to evaluate the performance. Net reclassification improvement (NRI) and integrated discrimination improvement (IDI) were used to compare the prediction accuracy between models.
Results: The clinicoradiologic model contained alpha-fetoprotein (AFP)_lg10, radiological capsule enhancement, enhancement pattern and arterial peritumoral enhancement, which were independent risk factors of MVI. There were 18 radiomics features related to MVI constructed the radiomics model. The mean area under the receiver operating curve (AUC) of clinicoradiologic, radiomics and clinicoradiomics model were 0.849, 0.925 and 0.950 in the training cohort and 0.846, 0.907 and 0.933 in the validation cohort, respectively. The three models’ calibration curves fitted well, and decision curve analysis (DCA) confirmed the clinical usefulness. Compared with the clinicoradiologic model, the NRI of radiomics and clinicoradiomics model increased significantly by 0.575 and 0.825, respectively, and the IDI increased significantly by 0.280 and 0.398, respectively.
Conclusions: Radiomics of preoperative multi-sequence MRI can improve the predictive performance of MVI in HCC.
Keywords: Radiomics; Magnetic resonance imaging; Microvascular invasion; Hepatocellular carcinoma; Predictive performance
| Introduction | ▴Top |
Hepatocellular carcinoma (HCC) is the sixth most common cancer worldwide and the third leading cause of cancer-related death [1, 2]. In 2020, there were 905,677 new cases and 830,180 new deaths in the world [2]. New HCC cases and deaths in China account for about 50% of the world [3]. The etiology of liver disease is crucial, as recent studies have revealed how it impacts the development and prognosis of HCC [4]. For HCC patients with well-preserved liver function and solitary neoplasm, surgical resection is the optimal treatment [5]. However, tumor recurrence within 5 years after hepatectomy is as high as 70%, and even liver transplantation is as high as 20% [6-9]. Studies have shown that microvascular invasion (MVI) is an independent risk factor for recurrence and poor prognosis of HCC after surgical resection or transplantation [10, 11].
MVI has a reported incidence of 15-57% according to different diagnostic criteria and study population [12, 13]. Accurate preoperative prediction of MVI is of great significance to the individualized treatment decision of HCC. For HCC patients with MVI, liver transplantation is not recommended according to the new Milan criteria [14], and surgical resection is recommended anatomical hepatectomy or partial hepatectomy with wide resection margin [15]. In addition, for small HCC with MVI, the early recurrence rate of surgical resection group was significantly lower than that of radiofrequency ablation group [16]. However, the gold standard for MVI is pathological biopsy, it is invasive and lags behind. Therefore, a new method for preoperative evaluation of MVI status is needed [17].
Enhanced magnetic resonance imaging (MRI) demonstrates strong predictive capabilities for MVI. The heightened sensitivity of hepatobiliary contrast agent-based MRI in diagnosing small HCC cases lacking arterial enhancement is of utmost importance for early HCC detection, ultimately reducing the incidence of HCC with MVI [18]. Many studies have reported multiple MRI features to predict MVI of HCC, including large tumor diameter [19], non-smooth margin [20, 21], non-radiological capsule enhancement [22], arterial peritumoral enhancement [16, 21], rim arterial phase hyperenhancement [23], and non-peripheral “washout” [22, 24]. But these imaging features are subjective and different between observers. Radiomics is an emerging field. It performs high-throughput data mining and quantification from radiological images, which provides important explanations for cancer phenotypes and tumor microenvironment [25, 26]. This is a noninvasive and objective method that can predict MVI of HCC preoperatively (before surgery).
In recent years, there have been many studies on the prediction of MVI by radiomics, and many radiomics models have been established. However, compared with the traditional model, there is no report on the improvement of the prediction accuracy of the radiomics model. The purpose of this study was to demonstrate the value of radiomics in predicting MVI of HCC.
| Materials and Methods | ▴Top |
Study participants
This retrospective study was approved by the Ethics Committee of Eastern Hepatobiliary Surgery Hospital, the Third Affiliated Hospital of Shanghai Naval Military Medical University, China, and the requirement of obtaining written informed consent was waived. The study was conducted in compliance with the ethical standards of the responsible institution on human subjects as well as with the Helsinki Declaration.
A total of 559 patients who underwent preoperative enhanced magnetic resonance (MR) for liver examination from January 2016 to January 2019 were searched in the hospital workstation. Totally, 206 primary HCC patients were finally recruited into this research (mean age: 55.19 ± 10.69 years, 34 women and 172 men). The inclusion criteria were as follows: 1) The pathological diagnosis was HCC, and the treatment option was surgical resection; 2) Enhanced MR within 1 month before hepatectomy and with suitable image quality; 3) MVI status is reported in pathological report; 4) The preoperative imaging examination and postoperative pathological results showed that there was no macrovascular invasion, no bile duct tumor thrombosis or extrahepatic metastasis; 5) Without previous treatment history, such as local ablation, partial hepatectomy, radiotherapy, chemotherapy or transarterial chemoembolization. The inclusion flow chart of the study patient is shown in Figure 1.
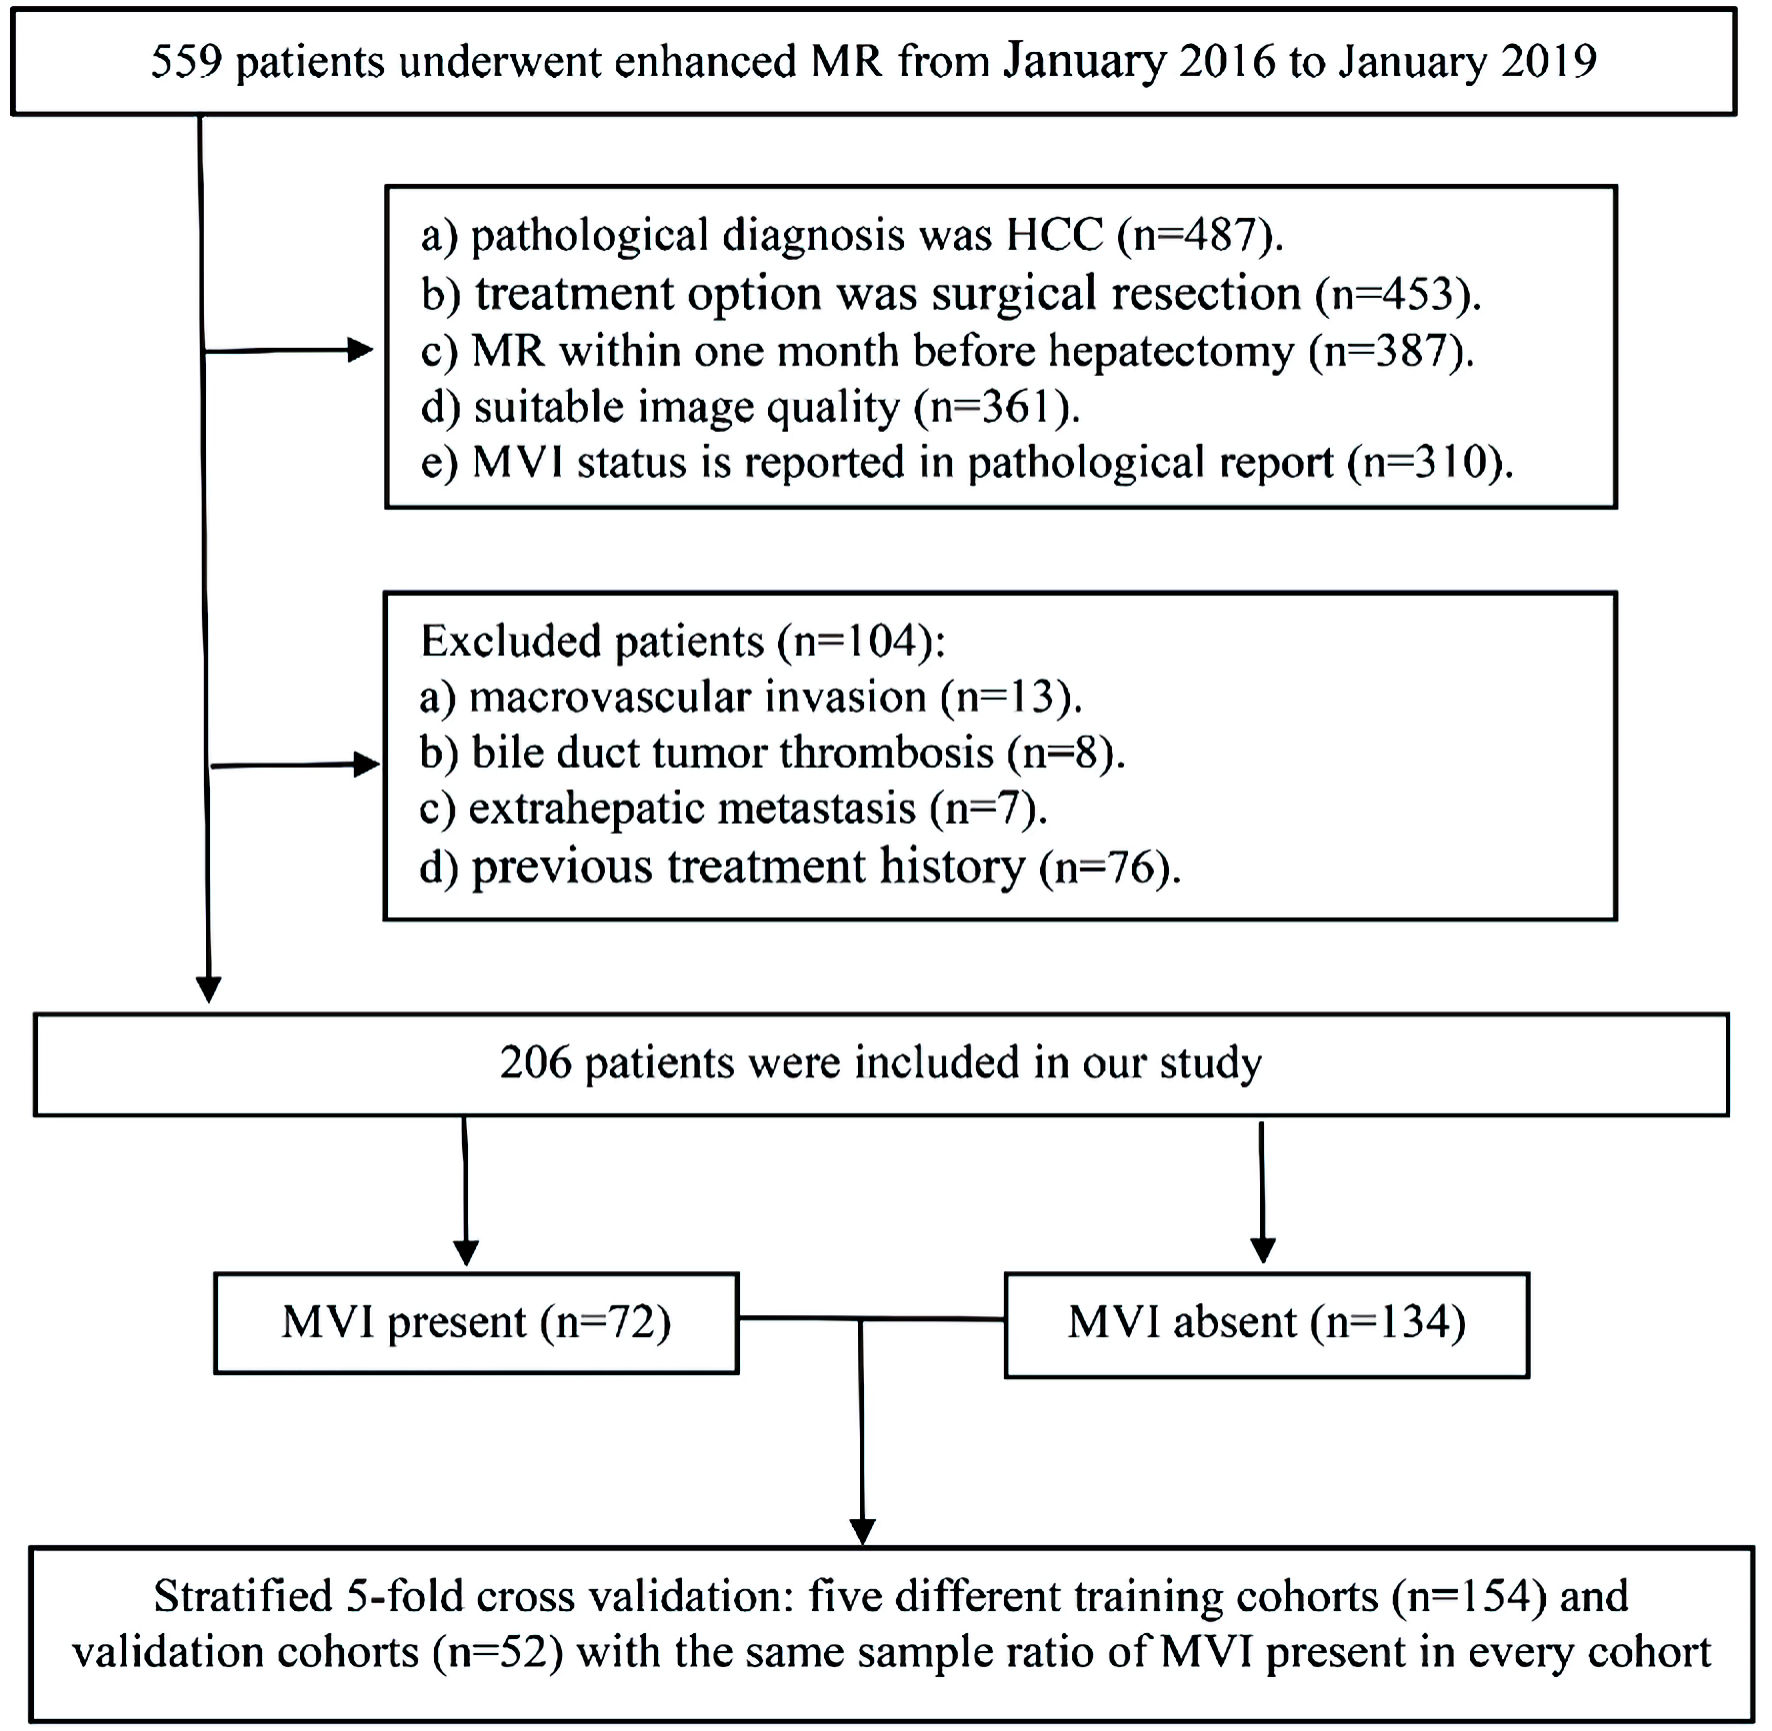 Click for large image | Figure 1. The workflow of patient selection for this study. MR: magnetic resonance; MVI: microvascular invasion; HCC: hepatocellular carcinoma. |
MRI image acquisition
All MR scans were performed at a 1.5T MR (optima MR360, GE Healthcare) with eight-channel abdominal coil. After fasting for 4 h, the patient was injected with gadopentetate dimeglumine (Gd-DTPA) into the median cubitus vein, with a total dose of 0.1 mmol/kg, using a high-pressure syringe at the rate of 2.0 mL/s, and then rinsed with 20 mL physiological saline. At 35 - 45 s, 55 - 70 s and 100 - 180 s after injection of contrast agent, arterial phase (AP), portal phase (PP) and delayed phase (DP) scans were performed respectively. T1-weighted imaging (T1WI), Fat-suppressed T2-weighted imaging (T2WI) and diffusion-weighted imaging (DWI) were collected. The MRI settings used in the present study are detailed here (Supplementary Material 1, www.wjon.org).
MR imaging analysis
Two radiologists with more than 5 years’ experience in abdominal MRI performed blind review of MR images of all patients. In case of disagreement, the third radiologist with more than 10 years’ experience in liver MRI will be invited to join the discussion and make a decision.
A total of 12 imaging features were evaluated: 1) Tumor diameter; 2) Radiological capsule enhancement; 3) Restricted diffusion; 4) Nonrim arterial phase hyperenhancement (APHE); 5) Rim APHE; 6) Non-peripheral “washout”; 7) tumor number; 8) Shape; 9) Margin [21, 27]; 10) Enhancement pattern; 11) Arterial peritumoral enhancement [21, 28, 29]; 12) MRI liver cirrhosis. Criteria 1) to 6) were defined in LI-RADS v2018 [30], and the whole definition could be found here (Supplementary Material 2, www.wjon.org).
Clinical variables, pathologic factors, and MVI
Laboratory indexes, demographic information, and pathological results of patients were retrieved through the hospital case system.
Pathologist of the patient’s Hospital evaluated the MVI of HCC by referring to the latest practice guideline for pathological diagnosis formulated in China. It was recommended that the risk be stratified according to the following quantities and distributions, as follows: M0: no MVI; M1 (low-risk): MVI of < 5 and at ≤ 1 cm away from the adjacent liver tissues; and M2 (high-risk): MVI of > 5 or at > 1 cm away from the adjacent liver tissues [31]. In our study, M0 was MVI absent, M1 and M2 were MVI present.
Radiomics analysis of MR images
The workflow of the radiomics analysis is shown in Figure 2.
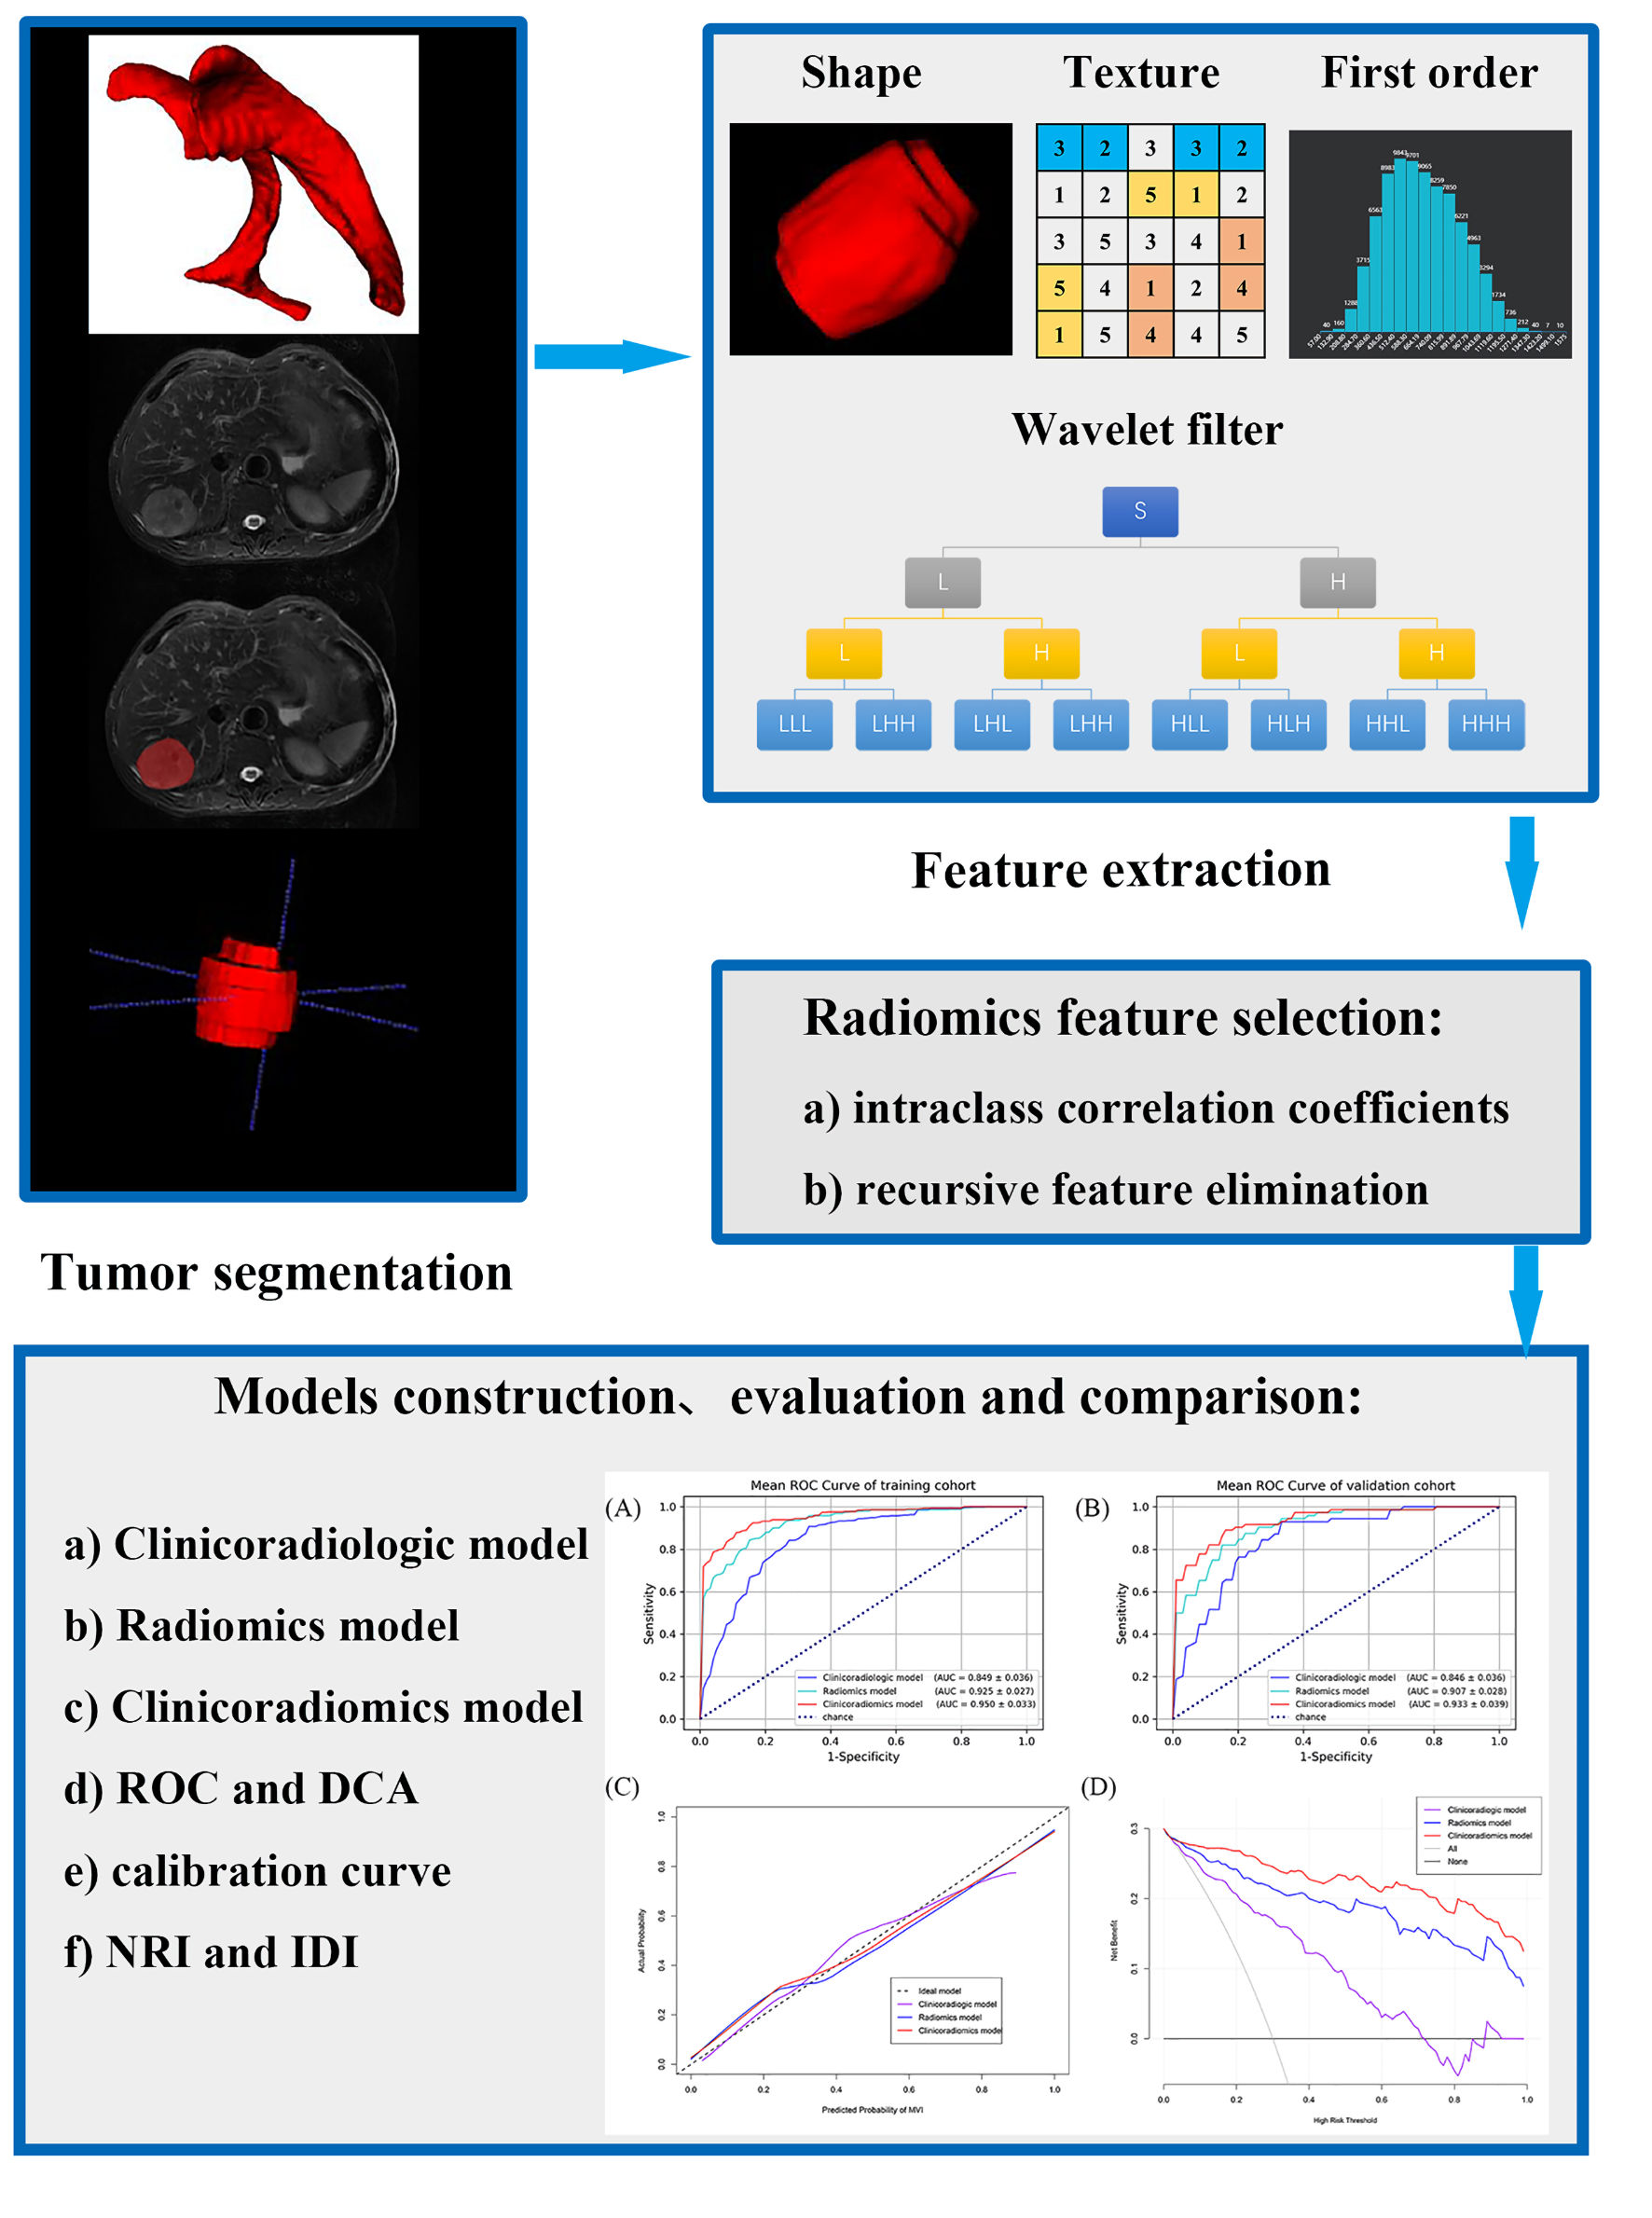 Click for large image | Figure 2. The workflow of the radiomics analysis. ROC: receiver operating characteristic; DCA: decision curve analysis; NRI: net reclassification improvement; IDI: integrated discrimination improvement. |
Segmentation
Three-dimensional segmentation of HCC was manually delineated by two radiologists (S.K.R and L.W.M, 5 years of experience in liver MRI), on the T1WI, T2WI, DWI with b values of 600 s/mm2, AP, PP and DP, covering the whole tumor, by using ITK-SNAP software. Radiologist 3 (J.N.Y, 20 years of experience in liver MRI) independently validated the segmentation. We also conducted test-retest procedures on 30 randomly selected tumors. While testing the reproducibility of features extracted from repeated segmentation, features with intraclass correlation coefficients (ICCs) lower than 0.80 were also excluded [32].
Feature extraction
Before extracting features, images were resampled into a voxel size of 3 × 3 × 3 mm3 to standardize the voxel spacing, and voxel intensity values were discretized by using a fixed bin width of 5 HU to normalize intensities and reduce image noise, enabling the normalization of image intensity values and allow acquisition of isotropic voxels [33-35]. The radiomic features were extracted using the open-source package PyRadiomics. These include shape-based features, first order statistics, and textural features including gray level co-occurrence matrix (GLCM), gray level run length matrix (GLRLM), gray level size zone matrix (GLSZM) and gray level dependence matrix (GLDM). A total of 1,046 radiomic features are extracted from each three-dimensional segmentation, resulting in 6,276 features for each lesion in total.
Radiomics feature selection
Features with ICC less than 0.8 were removed, and the remaining features were standardized by using z-scores. Recursive feature elimination (RFE) was applied to select the radiomics features of single sequence and multi-sequence fusion.
Radiomics model construction
The models of single sequence and fusion sequence were constructed by logistic regression. The optimal radiomics model was selected according to the prediction accuracy and the area under the receiver operating curve (AUC).
Clinicoradiologic model construction
The clinical and MRI features with P value less than 0.05 in the univariate logistic regression analysis were included in the multivariate logistic regression analysis (forward logistic regression), and the selected variables were used to build the clinicoradiologic model according to expert opinions.
Models’ evaluation and comparison
Three models were established to predict MVI of HCC. The previous section introduced the clinicoradiologic model and the radiomics model. As the third model, the clinicoradiomics model was a combination of the features in the two models.
Evaluation
The discrimination was evaluated by the AUC of receiver operating characteristic (ROC). The predictive accuracy was quantified with accuracy and validated by calibration curves. The clinical utility was visualized through decision curve analysis (DCA) by quantifying the net benefits at different threshold probabilities.
Comparison
The Delong test was used to compare the statistical significance of AUC between models. The predictive accuracy improvement level and overall improvement level between the models were compared with net reclassification improvement (NRI) and integrated discrimination improvement (IDI) [36].
Statistical analysis
SPSS software (version 25.0, IBM), R software (version 3.6.0) and Python (version 3.5.6) were used for statistical analysis. In order to make the distribution of AFP (alpha-fetoprotein) and PIVKA-II (protein induced by vitamin K absence or antagonist-II) tend to be normal, lg10 transformation was performed on these two variables. ICC was used to determine the consistency of differences between observers, with ICC > 0.8 indicating good agreement.
| Results | ▴Top |
Clinicoradiological model
Clinicoradiological characteristics
It includes clinical features and MRI features of the ICC > 0.8 (Table 1). All baseline data can be found here (Supplementary Material 3, www.wjon.org). There were 206 patients in this study, including 172 males (83.5%) and 34 females (16.5%), with an average age of 55.19 ± 10.69 years. Totally, 134 patients were MVI negative, and 72 patients were MVI positive. Among the 206 patients, 181 had a history of hepatitis B (87.86%), five had hepatitis C (2.43%), one had schistosomal cirrhosis (0.49%), three had alcoholic cirrhosis (1.46%), and the remaining 16 had no history of liver disease (7.77%). Among the 78 patients with postoperative pathological confirmation of liver cirrhosis, one had schistosomal cirrhosis (1.28%), three had alcoholic cirrhosis (3.85%), and the remaining 74 had hepatitis B cirrhosis (94.87%).
 Click to view | Table 1. Baseline Characteristics for Predicting MVI |
Univariable logistic regression
According to the test level of P < 0.05, AFP_lg10, PIVKA-II_lg10, shape, margin, nonrim APHE, radiological capsule enhancement, rim APHE, non-peripheral “washout”, enhancement pattern, arterial peritumoral enhancement and MRI liver cirrhosis were significantly related to MVI in univariate analysis (Tables 1, 2).
Click to view | Table 2. Univariate and Multivariate Logistic Regression Analysis for Predicting MVI |
Multivariable logistic regression
The 11 variables selected by univariate analysis were included in multivariate logistic regression analysis (forward logistic regression), and four independent factors of MVI were screened (Table 2): AFP_lg10 (odds ratio (OR): 1.469; 95% confidence interval (CI): 1.002 - 2.154; P = 0.049), radiological capsule enhancement (incomplete/complete: OR: 4.101, 95% CI: 1.721 - 9.770, P = 0.001; absent/complete OR: 5.193, 95% CI: 1.797 - 15.009, P = 0.002), enhancement pattern (OR: 2.793; 95% CI: 1.358 - 5.742; P = 0.005), and arterial peritumoral enhancement (OR: 8.222; 95% CI: 3.917 - 17.259; P < 0.001).
Clinicoradiological model
The above four variables form the clinicoradiological model, with the mean AUC was 0.849 in the training cohort, and 0.846 in the validation cohort after stratified five-fold cross-validation for improving prediction (Fig. 3a, b). The accuracy, sensitivity and specificity were 0.779, 0.843, 0.727 in the training cohort and 0.743, 0.930, 0.667 in the validation cohort, respectively (Table 3).
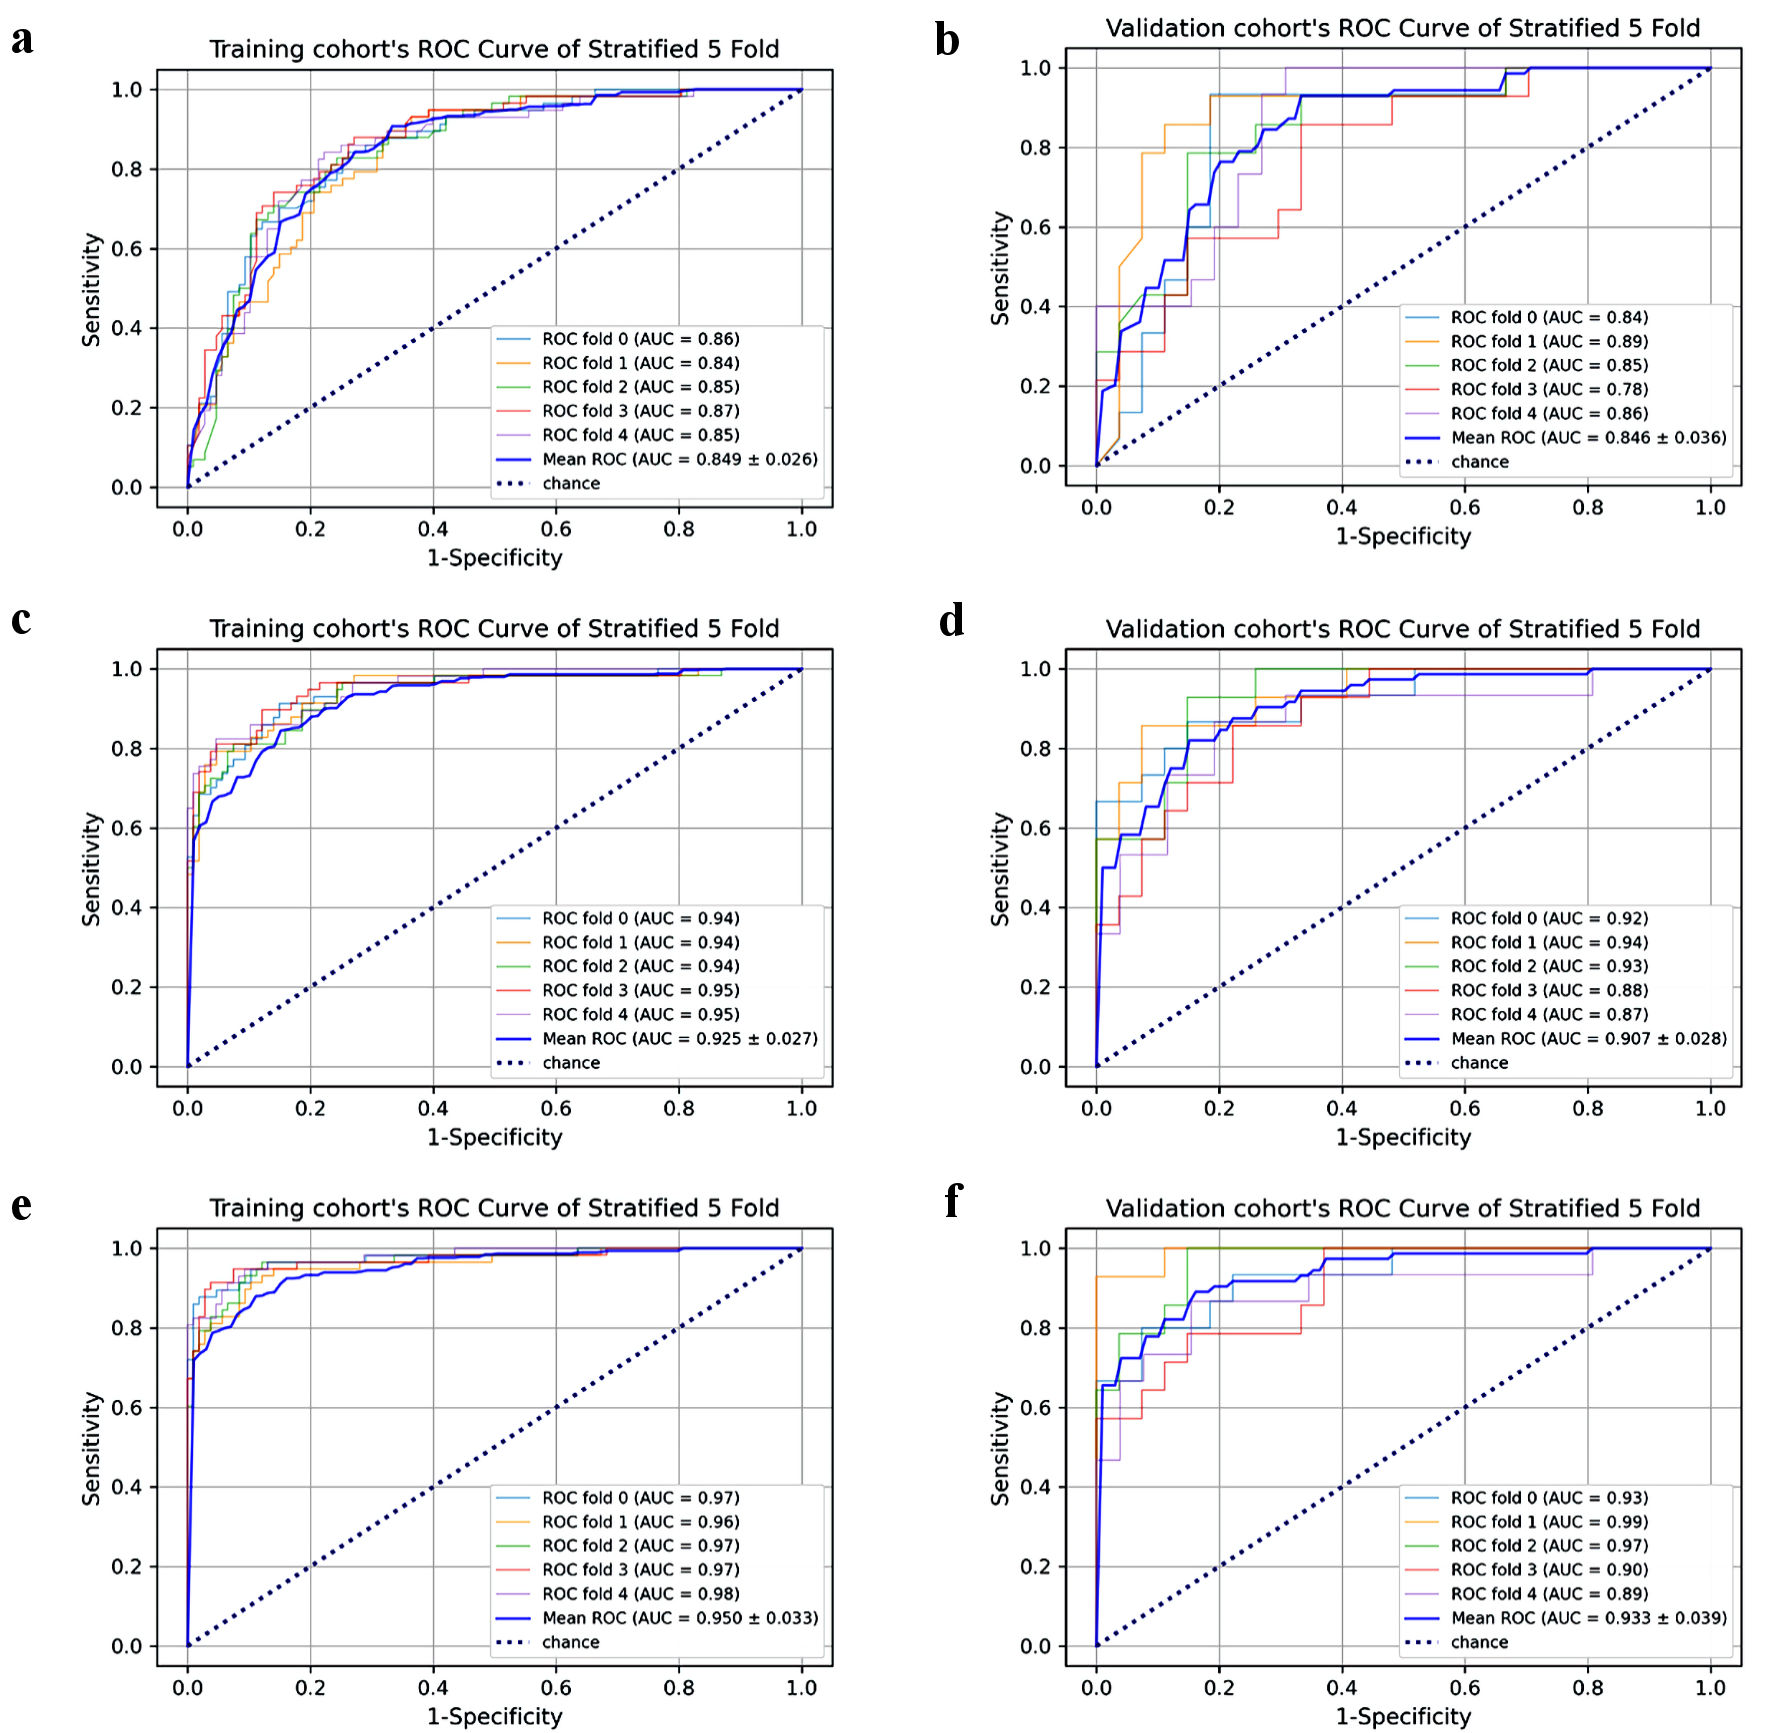 Click for large image | Figure 3. Each fold cross-validation’s AUC and mean AUC in training/validation cohort of the three models. Clinicoradiological model’s training cohort (a) and validation cohort (b). Radiomics model’s training cohort (c) and validation cohort (d). Clinicoradiomics model’s training cohort (e) and validation cohort (f). AUC: area under the receiver operating curve; ROC: receiver operating characteristic. |
Click to view | Table 3. The Mean Performances of Diverse Sequences After Stratified 5-Fold Cross-Validation for Predicting MVI |
Radiomics model and clinicoradiomics model
The number of radiomics features with the best model performance of each sequence and fusion sequence was selected between 10 and 20. The radiomics model performance of single sequence and fusion sequence after stratified five-fold cross-validation is shown in Table 3. Each fold cross-validation’s AUC (Supplementary Material 4, www.wjon.org) and feature names in every radiomics model could be seen here (Supplementary Material 5, 6, www.wjon.org).
Among the single sequence radiomics models, no model had better performance than the clinicoradiological model. Therefore, we combined two, three, four or all sequences to form a fusion radiomics model. After comparison, we selected all the sequence fusion model as the best radiomics model, with 18 radiomics features. The mean AUC (Fig. 3c, d), accuracy, sensitivity and specificity were 0.925, 0.883, 0.844, 0.848 in the training cohort and 0.907, 0.820, 0.820, 0.848 in the validation cohort, respectively (Table 3).
Four clinicoradiological variables and 18 radiomics features constituted clinicoradiomics model. The mean AUC (Fig. 3e, f), accuracy, sensitivity and specificity were 0.950, 0.779, 0.879, 0.889 in the training cohort and 0.933, 0.869, 0.890, 0.839 in the validation cohort, respectively (Table 3).
Performance and clinical practicability of the three models
The three models have good discrimination (Fig. 4a, b) after stratified five-fold cross-validation and the calibration curves (Fig. 4c) show that the predicted MVI present probability of the three models is consistent with the estimated value of the actual MVI present probability.
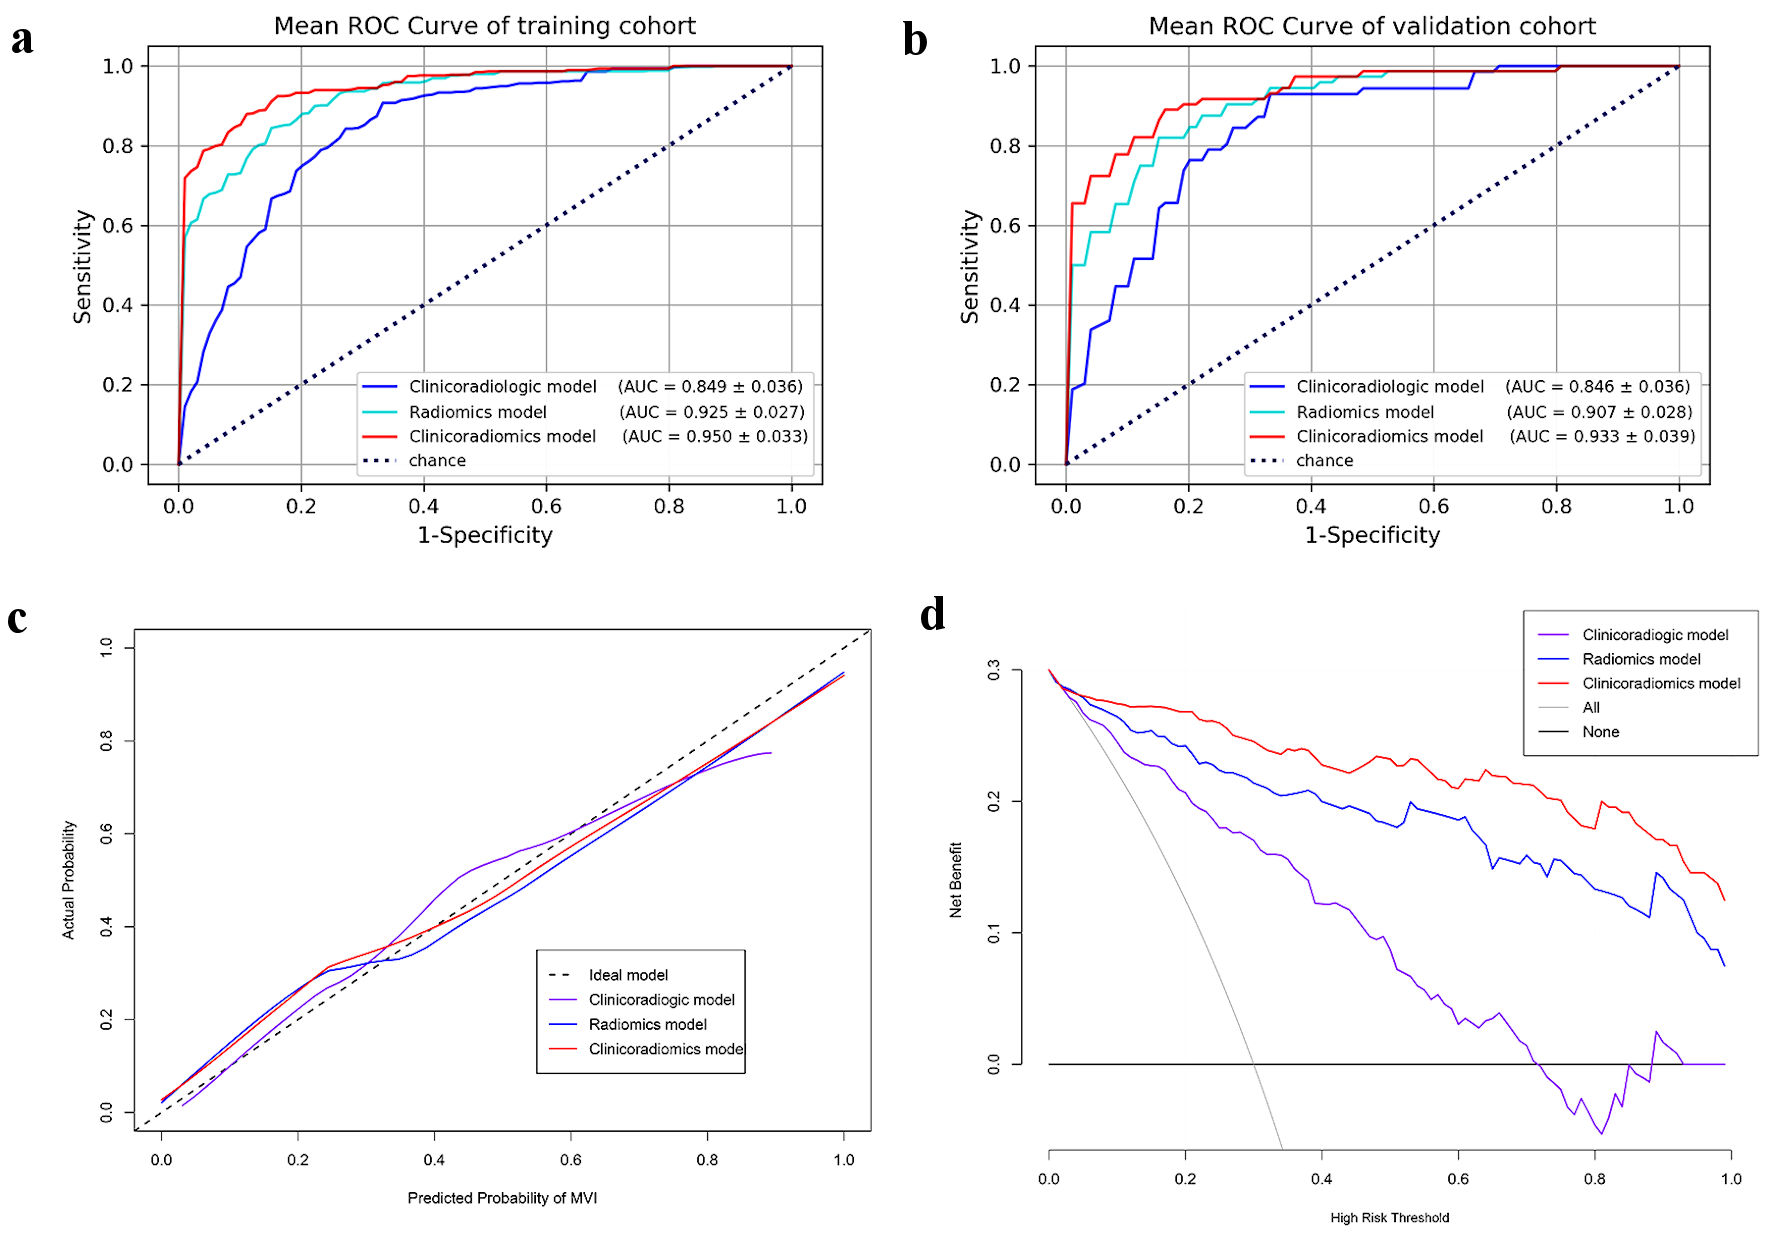 Click for large image | Figure 4. The three models’ mean ROC curves of training cohort (a) and validation cohort (b). Calibration curves (c) and DCA curves (d) of three models for predicting MVI of HCC. AUC: area under the receiver operating curve; ROC: receiver operating characteristic; DCA: decision curve analysis; MVI: microvascular invasion; HCC: hepatocellular carcinoma. |
The DCA curve of the three models is shown in Figure 4d, the black dotted line represents the hypothesis that all patients have MVI, and the black solid line represents the assumption that no patient has MVI; these are two extreme conditions. The purple solid line represents the clinicoradiological model, the blue solid line represents the radiomics model, and the red solid line represents the clinicoradiomics model. In the DCA, when the threshold probability is greater than 5%, the net benefit of the three models for predicting MVI of HCC is higher than the two extreme conditions, indicating that these models have potential clinical benefits. At the same time, the clinical net benefit of clinicoradiomics model is higher than radiomics model, and the radiomics model is higher than clinicoradiological model, which indicates that radiomics has a very large potential clinical benefit.
Comparison between models
It can be seen from the mean ROC curve (Fig. 4a, b) and decision curve (Fig. 4d) of the three models that the prediction performance of clinicoradiologic, radiomics and clinicoradiomics model is getting better and better, and radiomics plays an important role in improving the prediction performance of MVI. However, the predictive value of radiomics cannot be quantified and proved to be statistically significant. Therefore, we introduced NRI and IDI to demonstrate that radiomics can indeed improve the predictive performance of MVI in HCC and quantify its value.
The radiomics model outperformed the clinicoradiologic model (AUCs: 0.925 vs. 0.849, Delong test P = 0.0017). The proportion of correct reclassification of radiomics model was higher than clinicoradiologic model (NRI = 57.5%, P = 0.0014). The predictive performance of the radiomics model was 28% better than that of the clinicoradiologic model (IDI = 28%, P < 0.05).
The clinicoradiomics model was superior to the clinicoradiologic model (AUCs: 0.950 vs. 0.849, Delong test P < 0.0001), the proportion of correct reclassification was higher (NRI = 82.5%, P < 0.0001), and the predictive performance was also better (IDI = 39.8%, P < 0.05).
The discrimination of the clinicoradiomics model was better than that of the radiomics model (AUCs: 0.950 vs. 0.925, Delong test P = 0.0122). Not only the accuracy of reclassification prediction was improved by 31.3% (NRI = 31.3%, P = 0.0085), but also the accuracy of prediction was improved by 11.7% (IDI = 11.7%, P < 0.05).
The results show that both the models established by the radiomics itself and the models with the radiomics features are of great significance to improve the diagnostic efficiency. The detailed parameters of model comparison are shown in Table 4.
Click to view | Table 4. Comparison Between Models |
| Discussion | ▴Top |
In order to explore whether radiomics of preoperative multi-sequence MRI can improve the predictive performance of MVI in HCC, three models were established and validated by stratified five-fold cross-validation. A traditional clinicoradiologic model with clinical and MRI features, a radiomics model with only radiomics characteristics, and a clinicoradiomics model with a combination of the first two models.
Elevated AFP_lg10 level [32, 37, 38], incomplete or absent radiological capsule enhancement [37, 39], atypical enhancement pattern and arterial peritumoral enhancement [32, 37, 39, 40] were independent risk factors for predicting MVI and composed the clinicoradiologic model. In addition to atypical enhancement patterns, other independent risk factors have been reported in previous studies. Atypical enhancement pattern refers to other enhancement patterns except “washin” in AP and “washout” in PP. It contains more imaging information than nonrim APHE and non-peripheral “washout”, and it is a description of the dynamic enhancement process. In univariate logistic regression analysis, these three factors were all related to MVI, but in multivariate logistic regression analysis, only enhancement pattern was included in the final model, which was in line with our expectations. Due to the overlapping image information, only zero or one of these three variables could enter the clinicoradiologic model.
Our study established a radiomics model with 18 radiomics features screened from six MR sequences (T1WI, T2WI, DWI, AP, PP, DP), extracted from original and derived images. Eight first order statistics describe the distribution of voxel intensities within the image region defined by the mask through commonly used and basic metrics [40]. PP_wavelet-LLH_firstorder_Maximum and PP_wavelet-HLL_firstorder_Maximum represent the maximum gray level intensity within the region of interest (ROI); AP_wavelet-LHL_firstorder_90Percentile represents the 90th percentile of all voxels in the ROI in the AP; PP_wavelet-HLH_firstorder_InterquartileRange is the 75th percentile minus the 25th percentile of the image array; T1_wavelet-LLH_firstorder_Kurtosis and T1_wavelet-HLH_firstorder_Kurtosis, represent the “peakedness” of the distribution of values in the image ROI, a higher kurtosis implies that the mass of the distribution is concentrated towards the tail(s) rather than towards the mean, a lower kurtosis implies the reverse: that the mass of the distribution is concentrated towards a spike near the mean value; DP_wavelet-HHL_firstorder_Skewness and T2_log-sigma-5-0-mm-3D_firstorder_Skewness represent the asymmetry of the distribution of values about the mean value [41].
The other 10 radiomics features produced by texture analysis also contain important information, which may reflect the heterogeneity of MVI-present and MVI-absent HCCs [32, 42]. DP_wavelet-HHH_glcm_ClusterShade and DWI_wavelet-HLL_glcm_ClusterShade, are measures of the skewness and uniformity of the GLCM, the higher the cluster shadow, the greater the asymmetry of the mean value; PP_log-sigma-3-0-mm-3D_glcm_DifferenceVariance and DP_wavelet-LHL_glcm_DifferenceVariance are a measure of heterogeneity that places higher weights on differing intensity level pairs that deviate more from the mean; DP_wavelet-HLH_glcm_Autocorrelation represents the magnitude of the fineness and coarseness of texture; DWI_original_glcm_InverseVariance represents heterogeneity [41, 43]. T1_wavelet-LHL_glszm_SizeZoneNonUniformityNormalized measures the variability of size zone volumes throughout the image, with a lower value indicating more homogeneity among zone size volumes in the image; T1_log-sigma-3-0-mm-3D_glszm_LargeAreaLowGrayLevelEmphasis and T1_log-sigma-4-0-mm-3D_glszm_SmallAreaLowGrayLevelEmphasis measure the proportion in the image of the joint distribution of larger/smaller size zones with lower gray-level values; AP_wavelet-HLL_gldm_LargeDependenceHighGrayLevelEmphasis measures the joint distribution of large dependence with higher gray-level values [41, 44].
The radiomics approach possesses fundamental strengths, demonstrating the ability to predict specific factors with a high degree of accuracy and serving as a predictive biomarker, all while remaining noninvasive [45]. In contrast to numerous studies focused on biomarkers primarily prognostic in nature [46-48], informing patients about their life expectancy, radiomics, as a predictive biomarker, offers crucial insights associated with treatments, thereby directly impacting patients’ well-being. Our current study illustrates the predictive potential of radiomics in forecasting MVI in HCC. This predictive capacity results in significant alterations in patient management, particularly in the choice of surgical interventions, firmly establishing it as a predictive biomarker. Furthermore, the noninvasive nature of clinicoradiomics enables longitudinal assessments, allowing for multiple evaluations over time.
In the past 2 years, more and more studies on predicting MVI by radiomics analysis of HCC have been published [13]. A meta-analysis about radiomics for the preoperative evaluation of MVI in HCC showed high pooled sensitivity (0.84; 95% CI: 0.81, 0.87), specificity (0.83; 95% CI: 0.78, 0.87), and AUC (0.90; 95% CI: 0.87, 0.92) values [17]. A systematic review of radiomics models for predicting MVI in HCC showed the added value of radiomics in imaging modalities used in clinical routines has been explored extensively, with an AUC as high as 0.80 - 0.84 in two independent validation cohorts [13]. However, in all these studies [32, 33, 37, 39, 40, 49], the radiomics scores of the corresponding subjects were obtained through the optimal radiomics model in the training cohort, combined with independent risk clinicoradiologic factors to predict MVI of HCC, and verified in the validation cohort to prove that the model performed well. No study has shown whether the independent radiomics model can independently or even improve the predictive performance of MVI, and how much they can improve, compared with the traditional clinical or clinicoradiologic model [12, 21, 38, 50, 51]. However, our study confirmed this. Through the comparison between models, it was found that the NRI and IDI of the optimal radiomics model were 57.5% and 28.0% higher than the traditional clinicoradiologic model, respectively, with statistical significance. The NRI and IDI of the clinicoradiomics model composed of radiomics features and clinicoradiologic variables were significantly higher than the clinicoradiologic model by 82.5% and 39.8%, respectively, with statistical significance. This not only shows that radiomics of preoperative multi-sequence MRI can indeed improve the predictive performance of MVI in HCC, but also provides strong data support.
This study also has limitations. First, this is a retrospective study with possible selective bias. Second, this is a single-center study, and multi-center datasets should be used in subsequent studies to verify the results. Third, instead of using internal validation that divides the data into real training and validation cohorts, we used the stratified five-fold cross-validation to take full advantage of the data and balance the interclass bias, which may have some overfitting.
In conclusion, this study demonstrates that radiomics of preoperative multi-sequence MRI can indeed improve the predictive performance of MVI in HCC. We need to pay more attention to the role of radiomics in predicting MVI.
Learning points
Clinicoradiologic model, radiomics model, and clinicoradiomics model were established respectively.
Through the comparison between models, it was found that the radiomics of preoperative multi-sequence MRI can indeed improve the predictive performance of MVI in HCC.
It is important to emphasize the significance of radiomics in predicting MVI.
| Supplementary Material | ▴Top |
Suppl 1. Sequences and parameters of MRI
Suppl 2. The definition of LI-RADS v2018 imaging features
Suppl 3. Baseline characteristics for predicting MVI.
Suppl 4. The violin plot of AUC for each fold cross-validation of single sequence and fused sequence.
Suppl 5. The performances of each fold cross-validation for predicting MVI
Suppl 6. Feature names in every radiomics model
Acknowledgments
None to declare.
Financial Disclosure
This work was partially supported by the National Natural Science Foundation of China (Grant No:82227807, 81830059).
Conflict of Interest
The authors declare that the research was conducted in the absence of any commercial or financial relationships that could be construed as a potential conflict of interest.
Informed Consent
This retrospective study was approved by the Ethics Committee of Eastern Hepatobiliary Surgery Hospital, the Third Affiliated Hospital of Shanghai Naval Military Medical University, China, and the requirement of obtaining written informed consent was waived.
Author Contributions
All authors contributed to the study conception and design. Material preparation and data collection were performed by Meng Ting Gu, Hui Lin Chen, Kai Rong Song, Wei Zheng and Hui Yu. Analyses were performed by Ai E Liu and Wan Min Liu. The first draft of the manuscript was written by Wan Min Liu and Xing Yu Zhao. Xiang Zhou, Xiao Wen Xu, Ning Yang Jia and Pei Jun Wang revised and reviewed the article. All authors commented on previous versions of the manuscript. All authors read and approved the final manuscript.
Data Availability
The original contributions presented in the study are included in the article/supplementary material. Further inquiries can be directed to the corresponding authors.
Abbreviations
MVI: microvascular invasion; HCC: hepatocellular carcinoma; RFE: recursive feature elimination; NRI: net reclassification improvement; IDI: integrated discrimination improvement; AFP: alpha-fetoprotein; AUC: area under the receiver operating curve; DCA: decision curve analysis; MRI: magnetic resonance imaging; Gd-DTPA: gadopentetate dimeglumine; AP: arterial phase; PP: portal phase; DP: delayed phase T1WI, T1-weighted imaging; T2WI: T2-weighted imaging; DWI: diffusion-weighted imaging; APHE: arterial phase hyperenhancement; ICC: intraclass correlation coefficients; GLCM: gray level co-occurrence matrix; GLRLM: gray level run length matrix; GLSZM: gray level size zone matrix; GLDM: gray level dependence matrix; ROC: receiver operating characteristic; ROI: region of interest
| References | ▴Top |
- Siegel RL, Miller KD, Fuchs HE, Jemal A. Cancer statistics, 2021. CA Cancer J Clin. 2021;71(1):7-33.
doi pubmed - Sung H, Ferlay J, Siegel RL, Laversanne M, Soerjomataram I, Jemal A, Bray F. Global cancer statistics 2020: GLOBOCAN estimates of incidence and mortality worldwide for 36 cancers in 185 countries. CA Cancer J Clin. 2021;71(3):209-249.
doi pubmed - Zhou M, Wang H, Zeng X, Yin P, Zhu J, Chen W, Li X, et al. Mortality, morbidity, and risk factors in China and its provinces, 1990-2017: a systematic analysis for the Global Burden of Disease Study 2017. Lancet. 2019;394(10204):1145-1158.
doi pubmed pmc - Garuti F, Neri A, Avanzato F, Gramenzi A, Rampoldi D, Rucci P, Farinati F, et al. The changing scenario of hepatocellular carcinoma in Italy: an update. Liver Int. 2021;41(3):585-597.
doi pubmed - Villanueva A. Hepatocellular carcinoma. N Engl J Med. 2019;380(15):1450-1462.
doi pubmed - Vitale A, Peck-Radosavljevic M, Giannini EG, Vibert E, Sieghart W, Van Poucke S, Pawlik TM. Personalized treatment of patients with very early hepatocellular carcinoma. J Hepatol. 2017;66(2):412-423.
doi pubmed - Gunasekaran G, Bekki Y, Lourdusamy V, Schwartz M. Surgical treatments of hepatobiliary cancers. Hepatology. 2021;73(Suppl 1):128-136.
doi pubmed - Fujiwara N, Friedman SL, Goossens N, Hoshida Y. Risk factors and prevention of hepatocellular carcinoma in the era of precision medicine. J Hepatol. 2018;68(3):526-549.
doi pubmed pmc - Llovet JM, Schwartz M, Mazzaferro V. Resection and liver transplantation for hepatocellular carcinoma. Semin Liver Dis. 2005;25(2):181-200.
doi pubmed - Sheng X, Ji Y, Ren GP, Lu CL, Yun JP, Chen LH, Meng B, et al. A standardized pathological proposal for evaluating microvascular invasion of hepatocellular carcinoma: a multicenter study by LCPGC. Hepatol Int. 2020;14(6):1034-1047.
doi pubmed - Hong SB, Choi SH, Kim SY, Shim JH, Lee SS, Byun JH, Park SH, et al. MRI features for predicting microvascular invasion of hepatocellular carcinoma: a systematic review and meta-analysis. Liver Cancer. 2021;10(2):94-106.
doi pubmed pmc - Lei Z, Li J, Wu D, Xia Y, Wang Q, Si A, Wang K, et al. Nomogram for preoperative estimation of microvascular invasion risk in hepatitis B virus-related hepatocellular carcinoma within the Milan criteria. JAMA Surg. 2016;151(4):356-363.
doi pubmed - Wang Q, Li C, Zhang J, Hu X, Fan Y, Ma K, Sparrelid E, et al. Radiomics models for predicting microvascular invasion in hepatocellular carcinoma: a systematic review and radiomics quality score assessment. Cancers (Basel). 2021;13(22).
doi pubmed pmc - Mazzaferro V, Llovet JM, Miceli R, Bhoori S, Schiavo M, Mariani L, Camerini T, et al. Predicting survival after liver transplantation in patients with hepatocellular carcinoma beyond the Milan criteria: a retrospective, exploratory analysis. Lancet Oncol. 2009;10(1):35-43.
doi pubmed - Hwang S, Lee YJ, Kim KH, Ahn CS, Moon DB, Ha TY, Song GW, et al. The impact of tumor size on long-term survival outcomes after resection of solitary hepatocellular carcinoma: single-institution experience with 2558 patients. J Gastrointest Surg. 2015;19(7):1281-1290.
doi pubmed - Lee S, Kang TW, Song KD, Lee MW, Rhim H, Lim HK, Kim SY, et al. Effect of microvascular invasion risk on early recurrence of hepatocellular carcinoma after surgery and radiofrequency ablation. Ann Surg. 2021;273(3):564-571.
doi pubmed - Li L, Wu C, Huang Y, Chen J, Ye D, Su Z. Radiomics for the preoperative evaluation of microvascular invasion in hepatocellular carcinoma: a meta-analysis. Front Oncol. 2022;12:831996.
doi pubmed pmc - Granito A, Galassi M, Piscaglia F, Romanini L, Lucidi V, Renzulli M, Borghi A, et al. Impact of gadoxetic acid (Gd-EOB-DTPA)-enhanced magnetic resonance on the non-invasive diagnosis of small hepatocellular carcinoma: a prospective study. Aliment Pharmacol Ther. 2013;37(3):355-363.
doi pubmed - Ryu T, Takami Y, Wada Y, Tateishi M, Hara T, Yoshitomi M, Momosaki S, et al. A clinical scoring system for predicting microvascular invasion in patients with hepatocellular carcinoma within the milan criteria. J Gastrointest Surg. 2019;23(4):779-787.
doi pubmed - Kim AY, Sinn DH, Jeong WK, Kim YK, Kang TW, Ha SY, Park CK, et al. Hepatobiliary MRI as novel selection criteria in liver transplantation for hepatocellular carcinoma. J Hepatol. 2018;68(6):1144-1152.
doi pubmed - Lee S, Kim SH, Lee JE, Sinn DH, Park CK. Preoperative gadoxetic acid-enhanced MRI for predicting microvascular invasion in patients with single hepatocellular carcinoma. J Hepatol. 2017;67(3):526-534.
doi pubmed - Witjes CD, Willemssen FE, Verheij J, van der Veer SJ, Hansen BE, Verhoef C, de Man RA, et al. Histological differentiation grade and microvascular invasion of hepatocellular carcinoma predicted by dynamic contrast-enhanced MRI. J Magn Reson Imaging. 2012;36(3):641-647.
doi pubmed - Rhee H, An C, Kim HY, Yoo JE, Park YN, Kim MJ. Hepatocellular carcinoma with irregular rim-like arterial phase hyperenhancement: more aggressive pathologic features. Liver Cancer. 2019;8(1):24-40.
doi pubmed pmc - Ahn SJ, Kim JH, Park SJ, Kim ST, Han JK. Hepatocellular carcinoma: preoperative gadoxetic acid-enhanced MR imaging can predict early recurrence after curative resection using image features and texture analysis. Abdom Radiol (NY). 2019;44(2):539-548.
doi pubmed - Lambin P, Leijenaar RTH, Deist TM, Peerlings J, de Jong EEC, van Timmeren J, Sanduleanu S, et al. Radiomics: the bridge between medical imaging and personalized medicine. Nat Rev Clin Oncol. 2017;14(12):749-762.
doi pubmed - Gillies RJ, Kinahan PE, Hricak H. Radiomics: images are more than pictures, they are data. Radiology. 2016;278(2):563-577.
doi pubmed pmc - Ariizumi S, Kitagawa K, Kotera Y, Takahashi Y, Katagiri S, Kuwatsuru R, Yamamoto M. A non-smooth tumor margin in the hepatobiliary phase of gadoxetic acid disodium (Gd-EOB-DTPA)-enhanced magnetic resonance imaging predicts microscopic portal vein invasion, intrahepatic metastasis, and early recurrence after hepatectomy in patients with hepatocellular carcinoma. J Hepatobiliary Pancreat Sci. 2011;18(4):575-585.
doi pubmed - Renzulli M, Brocchi S, Cucchetti A, Mazzotti F, Mosconi C, Sportoletti C, Brandi G, et al. Can current preoperative imaging be used to detect microvascular invasion of hepatocellular carcinoma? Radiology. 2016;279(2):432-442.
doi pubmed - Chernyak V, Fowler KJ, Kamaya A, Kielar AZ, Elsayes KM, Bashir MR, Kono Y, et al. Liver imaging reporting and data system (LI-RADS) Version 2018: imaging of hepatocellular carcinoma in at-risk patients. Radiology. 2018;289(3):816-830.
doi pubmed pmc - American College of Radiology. CT/MRI liver imaging reporting and data system v2018 core. https://www.acr.org/Clinical-Resources/Reporting-and-Data-Systems/LI-RADS/CT-MRI-LI-RADS-v2018. [Accessed Dec 28, 2021].
- Cong WM, Bu H, Chen J, Dong H, Zhu YY, Feng LH, Chen J, et al. Practice guidelines for the pathological diagnosis of primary liver cancer: 2015 update. World J Gastroenterol. 2016;22(42):9279-9287.
doi pubmed pmc - Yang L, Gu D, Wei J, Yang C, Rao S, Wang W, Chen C, et al. A radiomics nomogram for preoperative prediction of microvascular invasion in hepatocellular carcinoma. Liver Cancer. 2019;8(5):373-386.
doi pubmed pmc - Gao L, Xiong M, Chen X, Han Z, Yan C, Ye R, Zhou L, et al. Multi-region radiomic analysis based on multi-sequence MRI can preoperatively predict microvascular invasion in hepatocellular carcinoma. Front Oncol. 2022;12:818681.
doi pubmed pmc - van Griethuysen JJM, Fedorov A, Parmar C, Hosny A, Aucoin N, Narayan V, Beets-Tan RGH, et al. Computational radiomics system to decode the radiographic phenotype. Cancer Res. 2017;77(21):e104-e107.
doi pubmed pmc - Zwanenburg A, Vallieres M, Abdalah MA, Aerts H, Andrearczyk V, Apte A, Ashrafinia S, et al. The image biomarker standardization initiative: standardized quantitative radiomics for high-throughput image-based phenotyping. Radiology. 2020;295(2):328-338.
doi pubmed pmc - Vickers AJ, Elkin EB. Decision curve analysis: a novel method for evaluating prediction models. Med Decis Making. 2006;26(6):565-574.
doi pubmed pmc - Chong HH, Yang L, Sheng RF, Yu YL, Wu DJ, Rao SX, Yang C, et al. Multi-scale and multi-parametric radiomics of gadoxetate disodium-enhanced MRI predicts microvascular invasion and outcome in patients with solitary hepatocellular carcinoma </= 5 cm. Eur Radiol. 2021;31(7):4824-4838.
doi pubmed pmc - Jiang H, Wei J, Fu F, Wei H, Qin Y, Duan T, Chen W, et al. Predicting microvascular invasion in hepatocellular carcinoma: A dual-institution study on gadoxetate disodium-enhanced MRI. Liver Int. 2022;42(5):1158-1172.
doi pubmed pmc - Xu X, Zhang HL, Liu QP, Sun SW, Zhang J, Zhu FP, Yang G, et al. Radiomic analysis of contrast-enhanced CT predicts microvascular invasion and outcome in hepatocellular carcinoma. J Hepatol. 2019;70(6):1133-1144.
doi pubmed - Yang Y, Fan W, Gu T, Yu L, Chen H, Lv Y, Liu H, et al. Radiomic features of multi-ROI and multi-phase MRI for the prediction of microvascular invasion in solitary hepatocellular carcinoma. Front Oncol. 2021;11:756216.
doi pubmed pmc - Zwanenburg A, Leger S, Vallieres M, Lock S, Initiative F. Image biomarker standardisation initiative. 2016.
- Chong H, Gong Y, Pan X, Liu A, Chen L, Yang C, Zeng M. Peritumoral dilation radiomics of gadoxetate disodium-enhanced MRI excellently predicts early recurrence of hepatocellular carcinoma without macrovascular invasion after hepatectomy. J Hepatocell Carcinoma. 2021;8:545-563.
doi pubmed pmc - Haralick RM, Shanmugam K, Dinstein I. Textural features for image classification. Studies in media and communication. 1973;SMC-3(6):610-621.
- Thibault G, Fertil B, Navarro C, et al. Texture indexes and gray level size zone matrix. Application to cell nuclei classification. Paper presented at: International Conference on Pattern Recognition 2009.
- Taha NA, Shafiq AM, Mohammed AH, Zaky AH, Omran OM, Ameen MG. FOS-like antigen 1 expression was associated with survival of hepatocellular carcinoma patients. World J Oncol. 2023;14(4):285-299.
doi pubmed pmc - Warli SM, Putrantyo, II, Laksmi LI. Correlation between tumor-associated collagen signature and fibroblast activation protein expression with prognosis of clear cell renal cell carcinoma patient. World J Oncol. 2023;14(2):145-149.
doi pubmed pmc - Chen S, Pan TY, Wu X, Li T, Wei Y, He HL, Zhou XM, et al. Uses of vascular endothelial growth factor C as a lung adenocarcinoma prognostic biomarker. World J Oncol. 2023;14(1):51-59.
doi pubmed pmc - Desai S, Guddati AK. Carcinoembryonic antigen, carbohydrate antigen 19-9, cancer antigen 125, prostate-specific antigen and other cancer markers: a primer on commonly used cancer markers. World J Oncol. 2023;14(1):4-14.
doi pubmed pmc - Renzulli M, Mottola M, Coppola F, Cocozza MA, Malavasi S, Cattabriga A, Vara G, et al. Automatically extracted machine learning features from preoperative CT to early predict microvascular invasion in HCC: The role of the zone of transition (ZOT). Cancers (Basel). 2022;14(7).
doi pubmed pmc - Tang M, Zhou Q, Huang M, Sun K, Wu T, Li X, Liao B, et al. Nomogram development and validation to predict hepatocellular carcinoma tumor behavior by preoperative gadoxetic acid-enhanced MRI. Eur Radiol. 2021;31(11):8615-8627.
doi pubmed - Zhang K, Xie SS, Li WC, Ye ZX, Shen ZW, Shen W. Prediction of microvascular invasion in HCC by a scoring model combining Gd-EOB-DTPA MRI and biochemical indicators. Eur Radiol. 2022;32(6):4186-4197.
doi pubmed
This article is distributed under the terms of the Creative Commons Attribution Non-Commercial 4.0 International License, which permits unrestricted non-commercial use, distribution, and reproduction in any medium, provided the original work is properly cited.
World Journal of Oncology is published by Elmer Press Inc.