

| World Journal of Oncology, ISSN 1920-4531 print, 1920-454X online, Open Access |
| Article copyright, the authors; Journal compilation copyright, World J Oncol and Elmer Press Inc |
| Journal website https://www.wjon.org |
Original Article
Volume 15, Number 4, August 2024, pages 648-661

A New Ferroptosis-Related Long Non-Coding RNA Risk Model Predicts the Prognosis of Patients With Papillary Thyroid Cancer
Jun Yu Zhaoa, b, d, Jin Ming Yaoa, d, Xin Zhong Zhangc, Kai Li Wangc, Shan Jiangc, Si Yi Guoc, Qi Qi Shengc, Lin Liaoa, b, e ![]() , Jian Jun Dongc, e
, Jian Jun Dongc, e ![]()
aDepartment of Endocrinology and Metabology, The First Affiliated Hospital of Shandong First Medical University and Shandong Provincial Qianfoshan Hospital, Shandong Key Laboratory of Rheumatic Disease and Translational Medicine, Shandong Institute of Nephrology, Ji’nan 250014, China
bDepartment of Endocrinology and Metabology, Shandong Provincial Qianfoshan Hospital, Cheeloo College of Medicine, Shandong University, Ji’nan 250014, China
cDepartment of Endocrinology and Metabology, Qilu Hospital of Shandong University, Cheeloo College of Medicine, Shandong University, Ji’nan 250012, China
dThese authors contributed equally to this paper.
eCorresponding Author: Lin Liao, Department of Endocrinology and Metabology, The First Affiliated Hospital of Shandong First Medical University and Shandong Provincial Qianfoshan Hospital, Shandong Key Laboratory of Rheumatic Disease and Translational Medicine, Shandong Institute of Nephrology, Ji’nan 250014, China; Jian Jun Dong, Department of Endocrinology and Metabology, Qilu Hospital of Shandong University, Cheeloo College of Medicine, Shandong University, Ji’nan 250012, China
Manuscript submitted February 17, 2024, accepted May 1, 2024, published online July 5, 2024
Short title: The Prediction Model of PTC
doi: https://doi.org/10.14740/wjon1838
| Abstract | ▴Top |
Background: Ferroptosis is a novel form of regulated cell death that involves in cancer progression. However, the role of ferroptosis-related long non-coding RNAs (lncRNAs) in papillary thyroid cancer (PTC) remains to be elucidated. The purpose of this paper was to clarify the prognostic value of ferroptosis-related lncRNAs in PTC.
Methods: The transcriptome data and clinical information were downloaded from The Cancer Genome Atlas (TCGA) database. The correlation between ferroptosis-related genes (FRGs) and lncRNA was determined using Pearson correlation analysis. Multivariate Cox regression model (P < 0.01) was performed to establish a ferroptosis-related lncRNAs risk model. Kaplan-Meier survival analysis, receiver operating characteristic (ROC) curves, risk curve and nomograms were then performed to assess the accuracy and clinical applicability of prognostic models. The correlations between the prognosis model and clinicopathological variables, immune and m6A were analyzed. Finally, in vitro assays were performed to verify the role of LINC00900, LINC01614 and PARAL1 on the proliferation, migration and invasion in TPC-1 and BCPAP cells, as well as the relationship between three lncRNAs and ferroptosis.
Results: A five-ferroptosis-related lncRNAs (PARAL1, LINC00900, DPH6-DT, LINC01614, LPP-AS2) risk model was constructed. Based on the risk score, samples were divided into the high- and low-risk groups. Patients in the low-risk group had better prognosis than those in high-risk group. Compared to traditional clinicopathological features, risk score was more accurate in predicting prognosis in patients with PTC. Additionally, the difference of immune cell, function and checkpoints was observed between two groups. Moreover, experiments showed that LINC00900 promoted the proliferation, migration and invasion in TPC-1 and BCPAP cells, while LINC01614 and PARAL1 revealed opposite effects, all of which were related to ferroptosis.
Conclusions: In summary, we identified a five-ferroptosis-related lncRNAs risk model to predict the prognosis of PTC. Furthermore, our study also revealed that LINC00900 functioned as a tumor suppressor lncRNA, LINC01614 and PARAL1 as an oncogenic lncRNA in PTC.
Keywords: Ferroptosis; Prognostic model; lncRNA; LINC00900; LINC01614; PARAL1; Papillary thyroid cancer
| Introduction | ▴Top |
As the most common endocrine malignancy, thyroid cancer accounts for 3.4% of all tumors diagnosed each year [1]. Most thyroid cancers originate from thyroid follicular cells, including anaplastic thyroid cancer (ATC), poorly differentiated thyroid cancer (PDTC) and differentiated thyroid cancer (DTC), which is further divided into papillary thyroid cancer (PTC) and follicular thyroid cancer (FTC). In addition, there is also medullary thyroid cancer (MTC) derived from parafollicular cells [2]. PTC is the most common histological subtype of thyroid cancer, accounting for 90% of the total cases. Even though PTC shows low malignancy and invasiveness, recurrence and metastasis restrict the therapeutic effects [3].
Ferroptosis is an iron-dependent, regulated cell death triggered by lipid peroxidation [4, 5]. Inactivation of cellular antioxidant system, especially the cystine/glutamate antiporter (xc-)/glutathione (GSH)/glutathione peroxidase 4 (GPX4) axis is a significant cause of ferroptosis [6, 7]. A major target of lipid peroxidation is polyunsaturated fatty acids (PUFAs), the incorporation of which into phospholipids requires acyl-CoA synthetase long-chain family member 4 (ACSL4) [4]. Previous studies have indicated that ferroptosis is involved in multiple tumor progression, such as ovarian cancer [8, 9], renal cell cancer [6], pancreatic ductal adenocarcinoma (PDAC) [10] and glioblastoma [11]. In addition, ferroptosis is divided into several parts in regulating thyroid cancer, including activation of iron-containing enzymes by excess iron, lipid peroxidation in PUFAs, and defense disorder of an antioxidant system [12].
Long non-coding RNAs (lncRNAs) refer to non-coding RNAs with a length greater than 200 nucleotides [13], which can interfere gene expression at the transcriptional or post-transcriptional levels [14]. Several studies have reported lncRNAs involve in progression of breast cancer [15], hepatocellular cancer [16] and ovarian cancer [17], et al. A previous study suggested lncRNA Xist acts as competing endogenous RNA (ceRNA) to promote cell proliferation and tumor growth by sponging miR-34a in thyroid cancer [18]. Furthermore, lncRNA CERS6-AS1 enhanced cell viability and suppressed ferroptosis of PTC [19].
In this study, a model based on ferroptosis-associated differentially expressed lncRNAs was established for estimation of prognosis and for prediction of optimal therapy options.
| Materials and Methods | ▴Top |
Data acquisition and processing
The transcriptome data and clinical information of 567 samples were downloaded from The Cancer Genome Atlas (TCGA) database using R software. After excluding other types of thyroid cancer, 502 cases of PTC and 58 normal samples were retained for analyses, and then we convert Ensemble ID into gene symbol to distinguish mRNA and lncRNA. The clinical information, including gender, age, pathological stage, survival status and survival time were extracted.
TCGA is a public database, so no ethical approval is required. The study was conducted in compliance with the ethical standards of the responsible institution on human subjects as well as with the Helsinki Declaration.
Identification of ferroptosis-related lncRNAs
Two hundred fifty-nine ferroptosis-related genes (FRGs) were obtained from the FerrDb database [20]. The expression levels of FRGs were extracted. Pearson correlation analysis was used to detect the correlation between FRGs and lncRNA, and the correlation coefficient |R2| > 0.4 and P < 0.01 was considered the screening criteria. The expression levels of FRGs-related lncRNAs were extracted. To find out differentially expressed FRGs and FRGs-related lncRNAs in tumor samples and normal samples, the Wilcoxon rank-sum test was performed with screening criteria of false discovery rate (FDR) < 0.05 and |log2FC| ≥ 1. Gene Ontology (GO) and Kyoto Encyclopedia of Genes and Genomes (KEGG) analyses were conducted to explore the potential biological functions of ferroptosis-related differentially expressed genes (DEGs) (P < 0.05) with the R package clusterProfiler.
Construction and evaluation of prognostic signatures
To determine ferroptosis-related lncRNAs associated with the prognosis of PTC, univariate Cox regression and multivariate Cox regression model (P < 0.01) were performed. The risk score for each patient was calculated using the following formula: Risk Score = ∑(Coefi*Exi), and the patients were divided into high- and low-risk groups based on the median of risk score. Kaplan-Meier survival analysis, receiver operating characteristic (ROC) curves (R package “survival ROC”), risk curve and nomograms were then used to assess the accuracy and clinical applicability of prognostic models. Coexpression network was constructed using the STRING database and visualized by Cytoscape.
Immune analysis between high- and low-risk groups
“Limma” and “pheatmap” R package were used to identify the distribution of immune cells in high- and low-risk groups with various database including TIMER, CIBERSORT, CIBERSORT-ABS, QUANTISEQ, MCPCOUNTER, XCELL and EPIC. Immune function scores were determined using the R package “limma”, “GSVA”, “GSEABase”, “ggpubr” and “reshape2”. Immune checkpoint genes were obtained with the R package “limma”, “ggplot2” and “ggpubr”.
Cell culture and transfection
Human PTC cell lines TPC-1 (Procell Life Science&Technology Co., Ltd.) and BCPAP (Shanghai Zhong Qiao Xin Zhou Biotechnology Co., Ltd.) were cultured in RPMI-1640 (Gibco, USA) supplemented with 10% fetal bovine serum (FBS, Gibco, USA) and 1% penicillin/streptomycin and incubated at 37 °C with 5% CO2.
The transfection was performed with Lipo3000 transfection reagent (Invitrogen, USA).
siRNAs against LINC00900, LINC01614 and PARAL1 (si-LINC00900, si-LINC01614 and si-PARAL1) and the negative control (si-NC) were synthesized by GenePharma Co. Ltd. (Shanghai, China). The sense sequences are as follows: si-LINC00900: 5'-GGUCCAAGGUUGUUAUUUATT-3'; si-LINC01614: 5'-GCUGGAAGCAUUUCGUAAUTT-3'; si-PARAL1: 5'-GUCAUCUACACAUGAAUAATT-3'; siNC: 5'- UUCUCCGAACGUGUCACGUTT -3'.
Quantitative real-time PCR (qRT-PCR)
Total RNA was extracted by RNAiso plus (Takara, China) and subsequently reverse transcribed into cDNA with reverse transcription kit (Tiangen, China). Finally, TB Green Premix Ex Taq (Takara, China) was used to amplify cDNA with CFX96 Real-Time PCR Detection System (Bio-Rad, USA). The expression level was calculated by 2-ΔΔCt method, and β-actin was used as a negative control. Primer sequences were shown in Table 1.
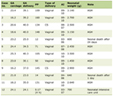 Click to view | Table 1. The sequence of Primers |
EdU assay
Cell proliferation was detected by EdU assay kit (RiboBio, China). The cells were seeded in 96-well plates after transfection. EdU solution (reagent A) was diluted at a ratio of 1,000:1, and cells were incubated with diluted reagent A for 2 h at 37 °C after adherence. Add 50 µL 4% paraformaldehyde to each well and incubate at room temperature for 30 min after discarding reagent A, and then 50 µL 2 mg/mL glycine was used for neutralization. After washing with phosphate-buffered saline (PBS), the cells were incubated with 100 µL 1 × Apollo staining reaction solution and then 1 × Hoechst 33342 reaction solution for 30 min away from light, respectively. Finally, images were captured with the fluorescence microscope (Olympus, Japan).
Migration and invasion assay
The cells were digested after transfection and suspended with complete medium. Then the cell suspension was transferred into a chamber. Basal medium (600 µL) was added to the lower chamber. The cells were incubated overnight at 37 °C and then fixed in 4% paraformaldehyde for 20 min and stained with crystal violet for 30 min. After wiping out the cells on the upper cells of the chamber, the cells were photographed with the fluorescence microscope (Olympus, Japan).
Clone formation assay
The cells were seeded into six-well plates (1,000 cells/well) after transfection. Following incubating for 7 days, the cells were fixed with 4% paraformaldehyde and then stained with crystal violet for 30 min. Images were taken to record the number of clones.
Determination of Fe2+ levels
The content of Fe2+ was determined with Ferrous ion Assay Kit (Elabscience, China). The cells were collected and added with buffer solution (0.4 mL/4 × 106 cells), then fragmented by sonication. The supernatant was extracted following centrifuging at 10,000 × g for 10 min. Add 300 µL of standards and samples to 1.5 mL EP tubes, respectively. Subsequently, chromogenic solution was added, mixed well, and incubated at 37 °C for 10 min. After centrifugation at 12,000 × g for 15 min, the supernatant was taken and added into microplate. The optical density (OD) values at 593 nm were measured with a microplate reader (iMark microplate reader; Bio-Rad).
Western blot
Total proteins were extracted with RIPA lysis buffer supplemented with protease inhibitors (Biyuntian, China). The protein concentration was measured with BCA kit (Biyuntian, China). Sodium dodecyl sulfate-polyacrylamide gel electrophoresis (SDS-PAGE) gels (10%) were used to separate proteins, which was then transferred to polyvinylidene fluoride (PVDF) membranes, blocked and incubated overnight with antibodies against ACSL4 (1:1,000; ab155282, Abcam) and GPX4 (1:1,000; ab125066, Abcam). After washed with Tris-buffered saline with Tween 20 (TBST), the membranes were incubated with secondary antibody (anti-rabbit, 1:10,000) for 1 h at room temperature. Finally, Enhanced chemiluminescence reagent (Millipore, USA) was used to detect chemiluminescence. β-actin (1:1,000; TA-09, Zhongshan Golden Bridge) was used as the control.
Statistical analysis
R software package (version 4.1.2) and GraphPad Prism (version 8.0.1) were applied for statistical analyses and visualization. The Wilcoxon rank-sum test was used to analyze the expression levels of FRGs and FRGs-related lncRNAs in tumor samples and normal samples. Univariate Cox regression analysis was performed to establish the relationship between ferroptosis-related lncRNAs and overall survival (OS), and multivariate Cox analysis was performed to construct a prognostic signature.
To compare the OS of high- and low-risk patients, the Kaplan-Meier survival analysis and log-rank test were applied. The “urvivalROC” package was used to determine area under the curve (AUC) values and construct ROC curves.
| Results | ▴Top |
Enrichment analysis of ferroptosis-related DEGs
A total of 29 ferroptosis-related DEGs were identified, 19 of which were upregulated and 10 of which were downregulated. GO and KEGG analyses were carried out. GO analysis revealed that ferroptosis-related DEGs were enriched in: 1) biological process (BP): response to oxidative stress, unsaturated fatty acid metabolic process, lipoxygenase pathway, etc.; 2) cellular component (CC): lamellipodium membrane, apical plasma membrane, apical part of cell, etc.; 3) molecular function (MF): oxidoreductase activity, acting on single donors with incorporation of molecular oxygen, iron ion binding, oxidoreductase activity, acting on single donors with incorporation of molecular oxygen, incorporation of two atoms of oxygen, etc. (Supplementary Material 1, www.wjon.org). KEGG analysis results showed that ferroptosis-related DEGs were mainly enriched in pathways related to AGE-RAGE signaling pathway in diabetic complications, serotonergic synapse, arachidonic acid metabolism, central carbon metabolism in cancer, hepatitis B, Epstein-Barr virus infection, hematopoietic cell lineage, Chagas disease, human T-cell leukemia virus 1 infection, Th17 cell differentiation, and African trypanosomiasis (Supplementary Material 1, www.wjon.org).
Establishment and validation of prognostic model based on ferroptosis-related lncRNA
The clinical data were combined with lncRNA expression data downloaded from TCGA. Figure 1a showed that how the five-gene signature of ferroptosis-related lncRNAs were identified. Univariate Cox proportional hazards regression analysis revealed that 16 lncRNAs were related to the prognosis of PTC. Fourteen lncRNAs with hazard ratio (HR) > 1 were defined as high risk, whereas two lncRNAs with HR < 1 were defined as low risk (Fig. 1b). Next, multivariate Cox proportional hazards regression analysis demonstrated five lncRNAs (PARAL1, LINC00900, DPH6-DT, LINC01614, LPP-AS2) as independent prognosis biomarkers (Fig. 1c). PARAL1, DPH6-DT, LINC01614, LPP-AS2 were risk factors, while LINC00900 was protective factors. Each gene expression associated with OS from TCGA data was analyzed, and only high expressed LINC00900 showed a significant survival benefit (Supplementary Material 2, www.wjon.org). The risk score of each sample was calculated as follows: (0.777302160104907) × PARAL1 expression + (-2.39733075460453) × LINC00900 expression + (3.00676211793275) × DPH6-DT expression + (0.108382333939635) × LINC01614 expression + (1.85457176547278) × LPP-AS2 expression.
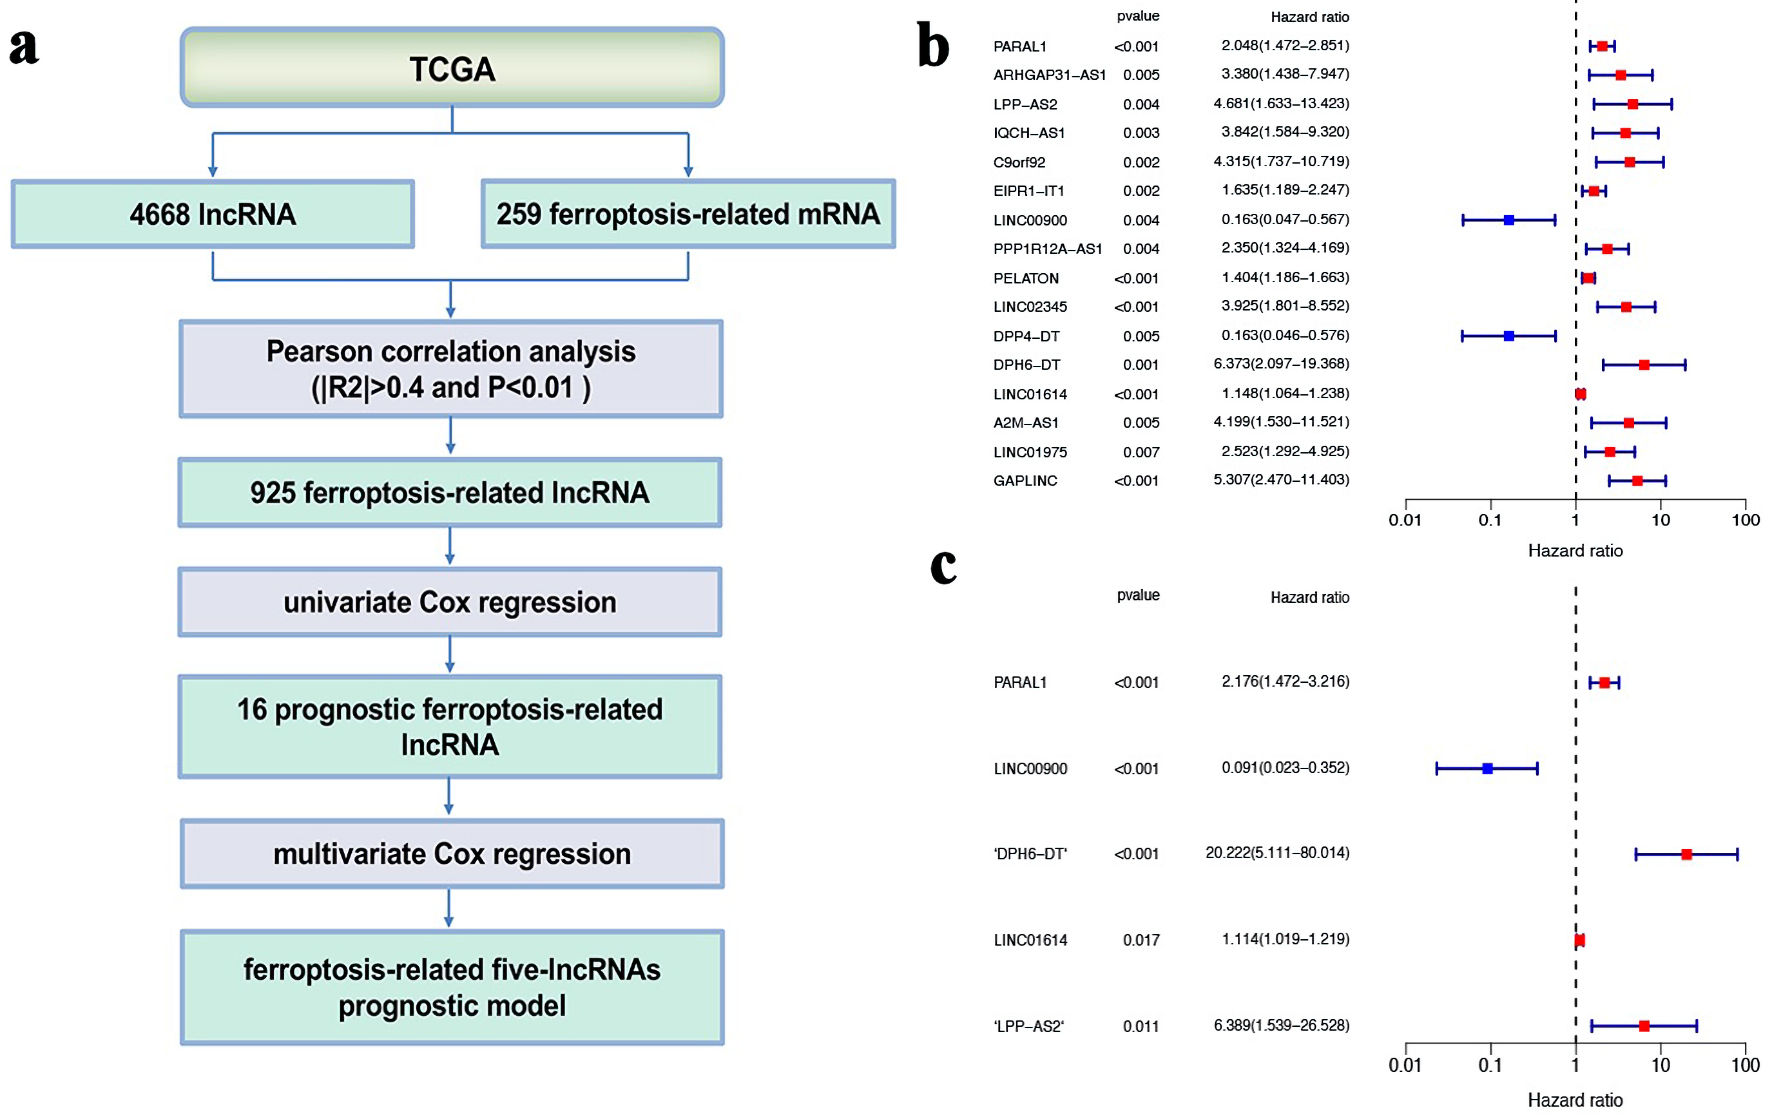 Click for large image | Figure 1. Determination of ferroptosis-related five-lncRNAs prognostic model. (a) The flowchart of how the five gene signature of ferroptosis-related lncRNAs were identified. (b) Univariate Cox regression analysis. (c) Multivariate Cox regression analysis. lncRNA: long non-coding RNA; TCGA: The Cancer Genome Atlas. |
Based on the median value of risk score, we divided PTC patients into two group: low-risk and high-risk. As shown here (Supplementary Material 3, www.wjon.org), there was an increasing number of deaths with the risk scores rising. The heat map was generated to illustrate the expression of the five ferroptosis-related lncRNAs in high- and low-risk groups (Fig. 2a). The Kaplan-Meier survival curves showed that patients in the high-risk group exhibited a worse prognosis than that in the low-risk group (Fig. 2b).
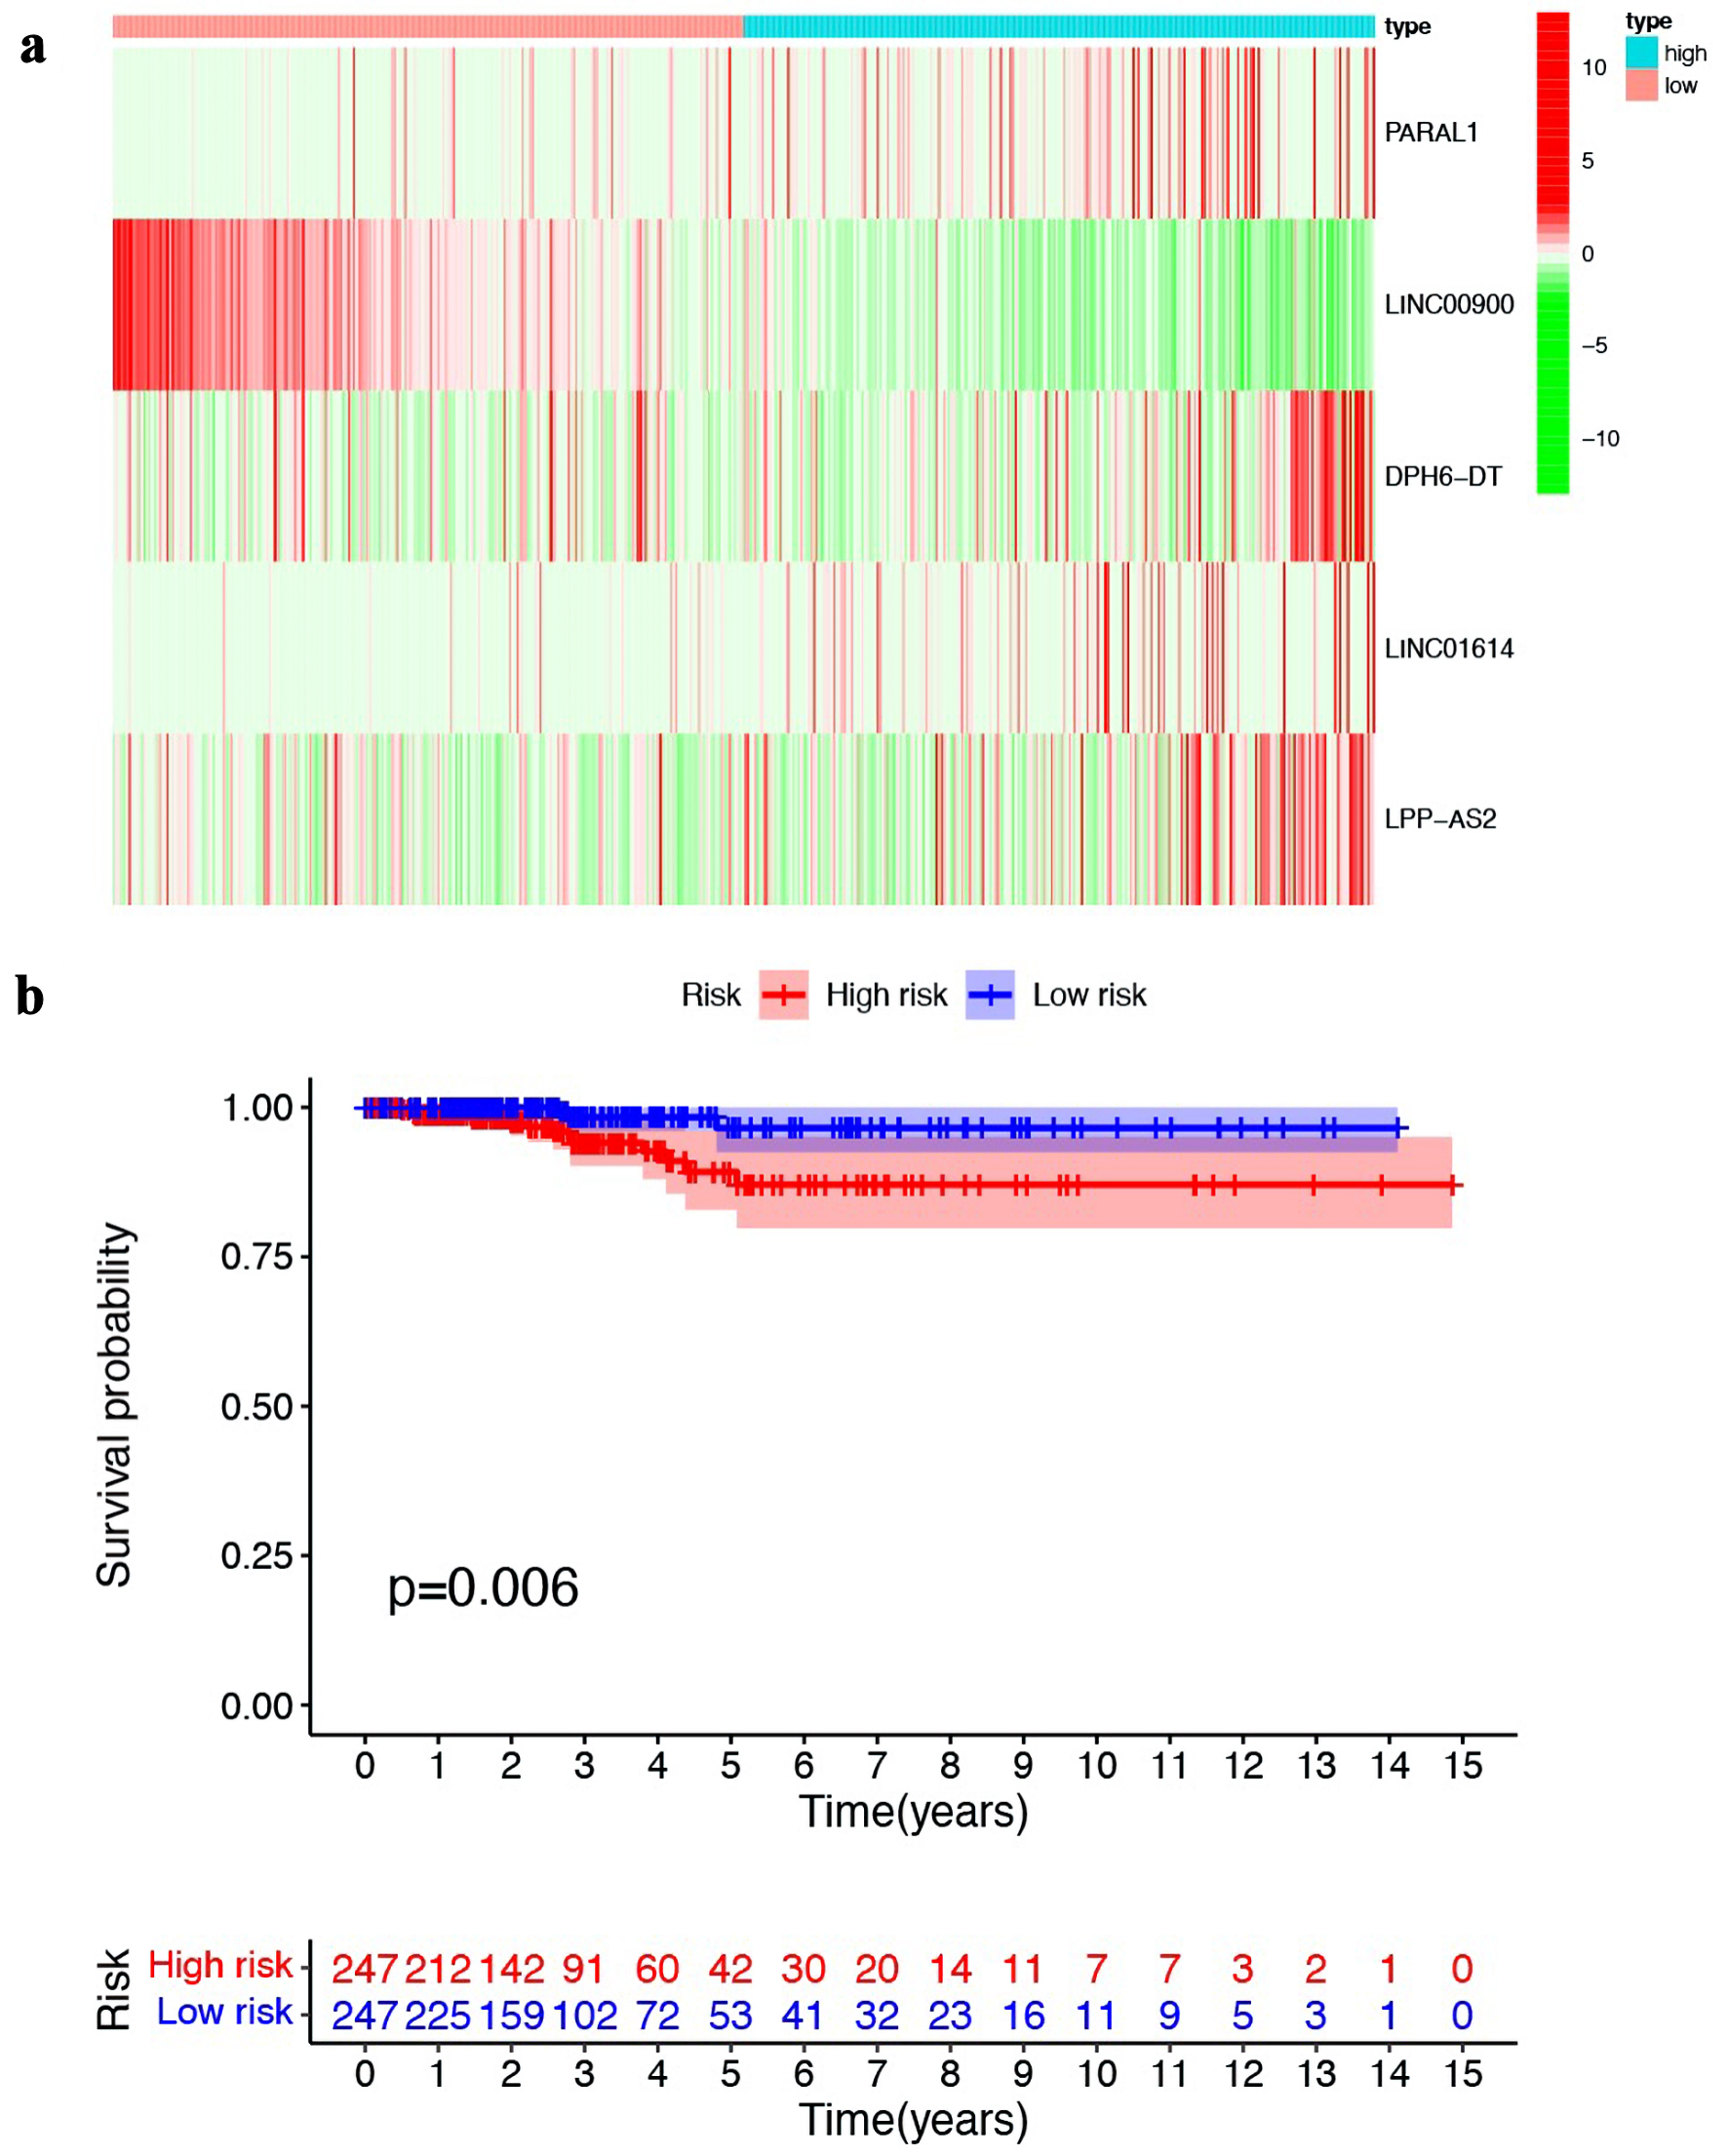 Click for large image | Figure 2. Establishment and validation of prognostic model based on ferroptosis-related lncRNA. (a) Heat map illustrating the expression of the five ferroptosis-related lncRNAs in high- and low-risk groups. (b) Kaplan-Meier survival curves comparing the overall survival of patients in high- and low-risk groups. lncRNA: long non-coding RNA. |
Risk score can be used as an independent risk factor for PTC prognostic prediction
The effect of ferroptosis-related five-lncRNA model for predicting the prognosis of PTC was further evaluated. Firstly, univariate Cox regression analysis results showed that age, stage, T stage, M stage and risk score were associated with the OS of PTC patients (Fig. 3a). Multivariate Cox regression analysis exhibited that age and risk score were independent predictors of OS of PTC patients (Fig. 3b). The AUC value of risk score was 0.998, which was higher than that of other factors (Fig. 3c), suggesting that risk score had a better prediction ability. AUC values for 1-, 2-, and 3-year survival were 0.748, 0.709, and 0.686, respectively (Fig. 3d). A nomogram integrating clinicopathological variables and the risk score was established for predicting 1-, 3- and 5-year survival rate of PTC patients (Fig. 3e).
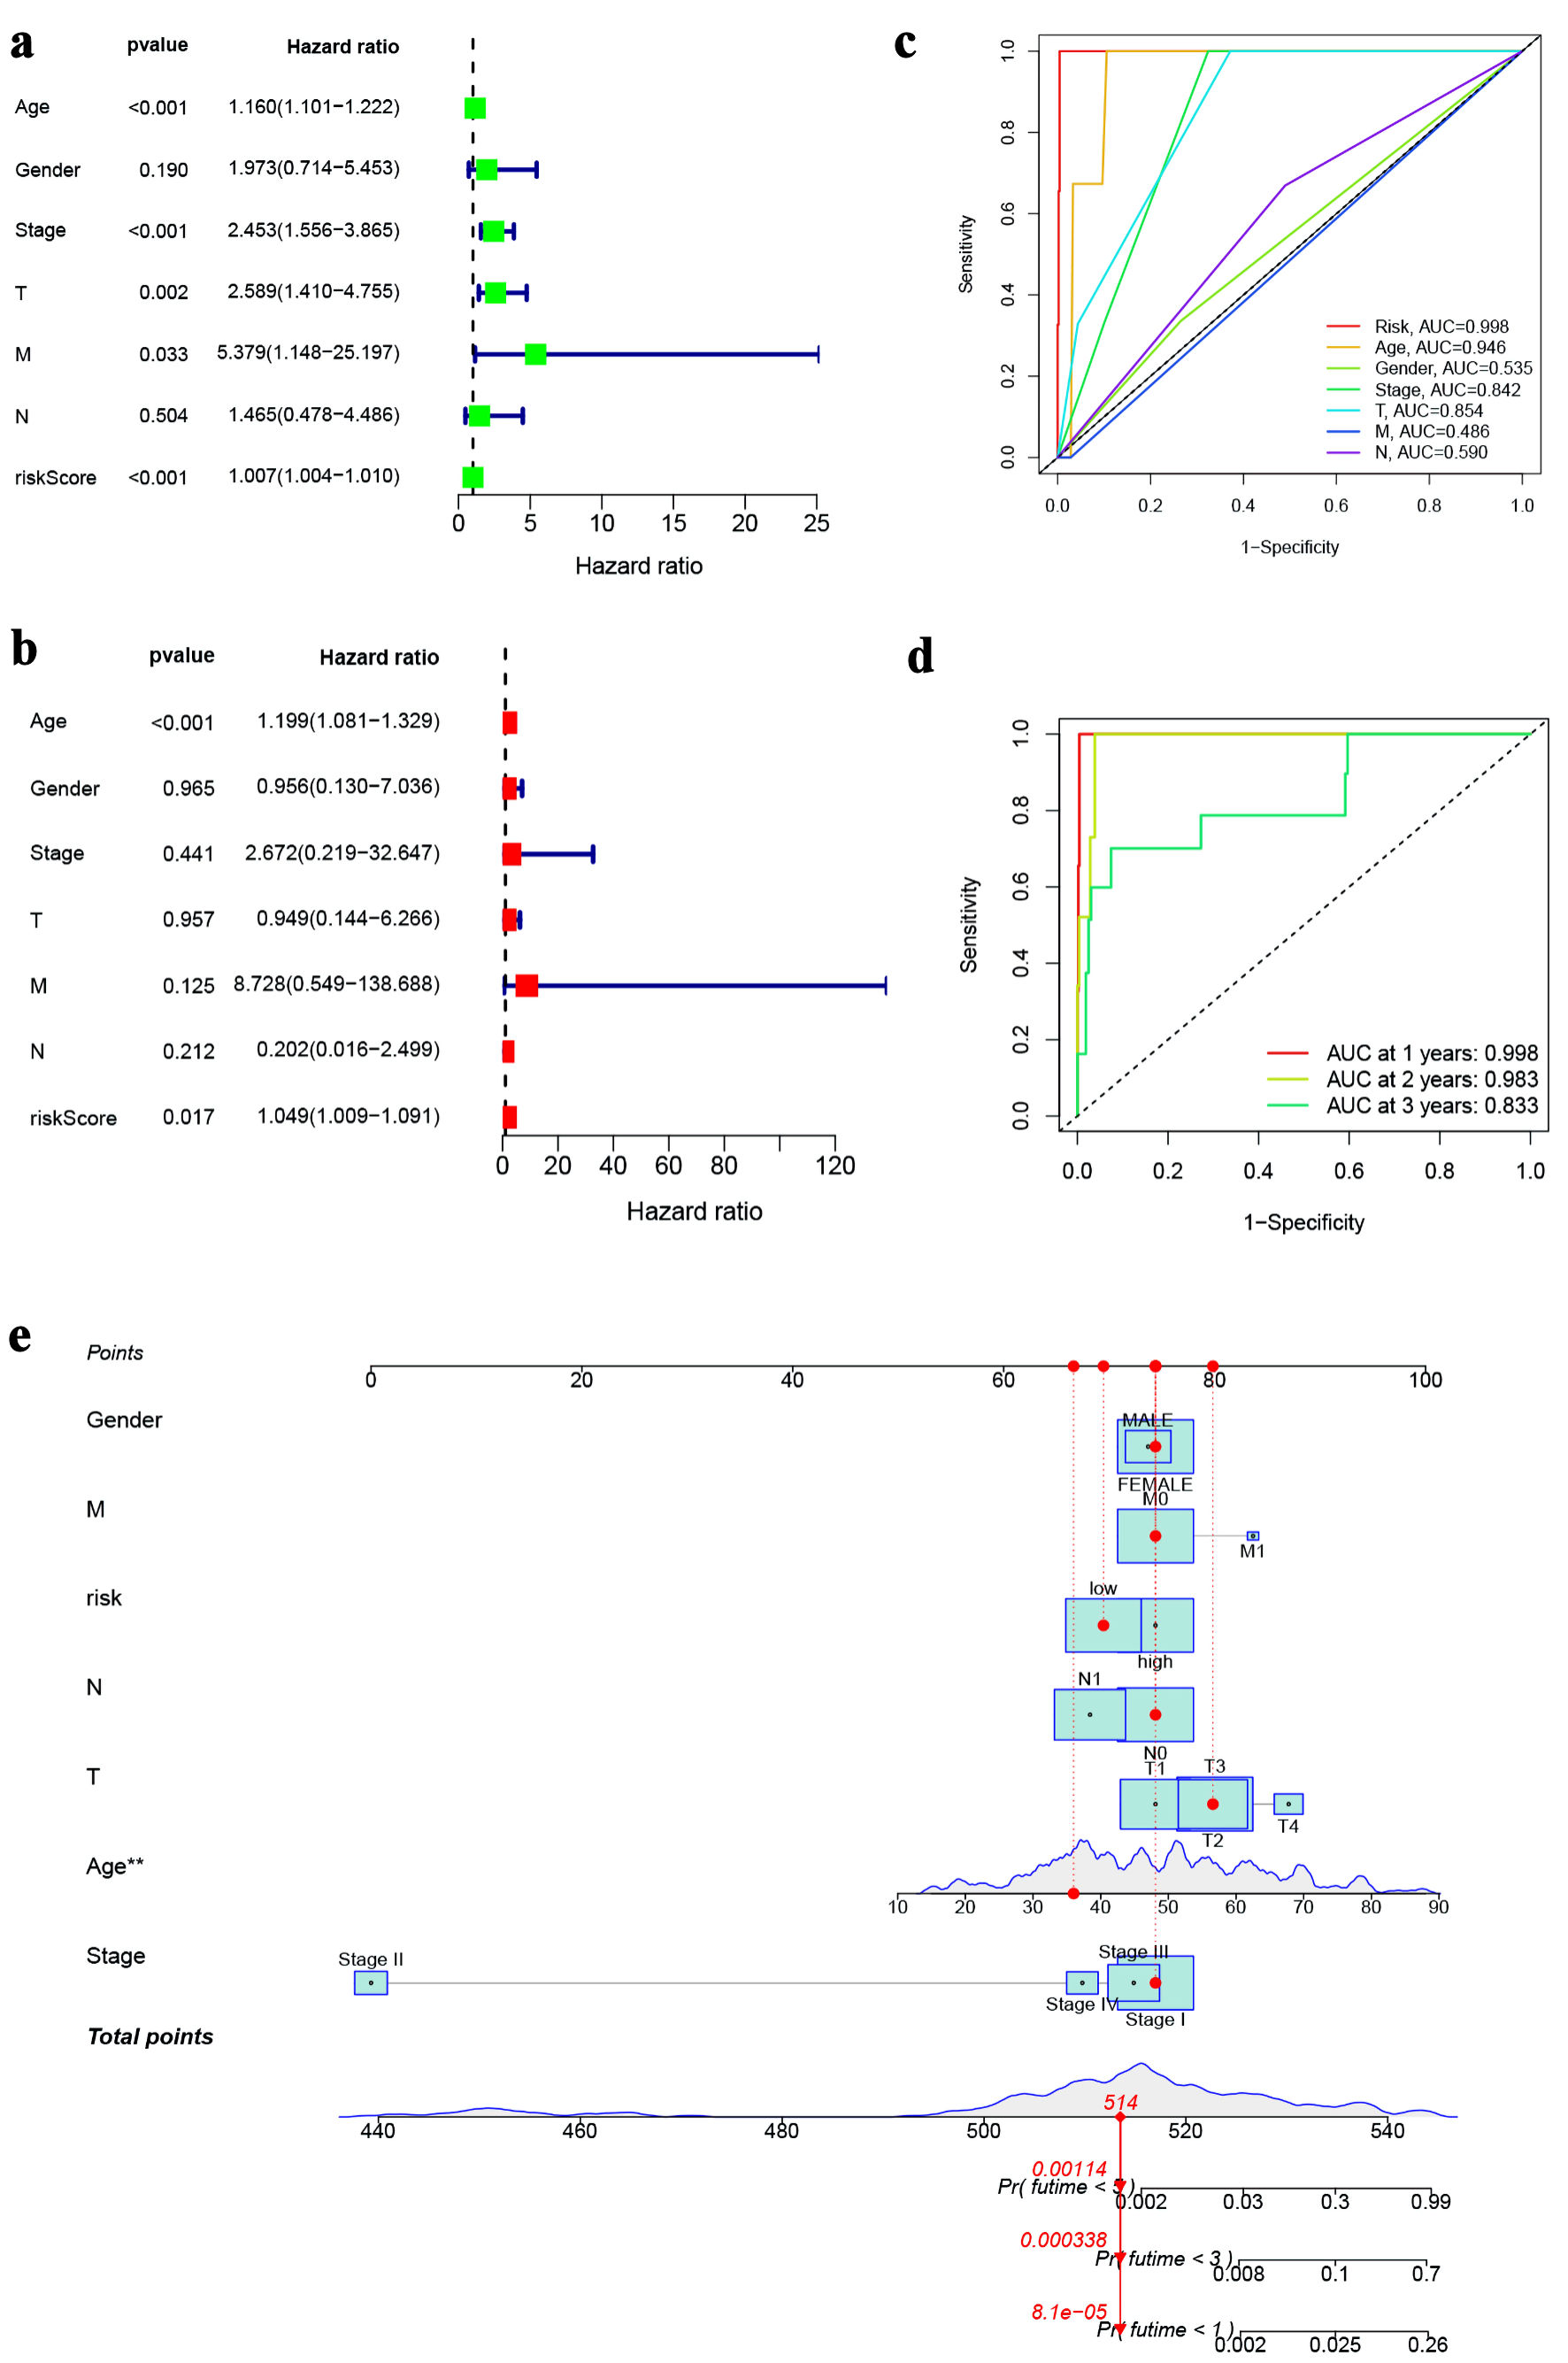 Click for large image | Figure 3. Prognostic value of ferroptosis-associated lncRNA model. (a) Forest plot for univariate cox regression analysis. (b) Forest plot for multivariate Cox regression analysis. (c) ROC curve for the risk score and clinicopathological variables. (d) ROC curve of the risk score at 1, 3, and 5 years. (e) Nomogram based on risk score and clinicopathological variables for predicting 1-, 3-, and 5-year survival rates. lncRNA: long non-coding RNA; ROC: receiver operating characteristic. |
Construction of coexpression network of the ferroptosis-related five lncRNAs and mRNA
The coexpression network containing 29 lncRNA-mRNA pairs was constructed. LPP-AS2 had a close relationship with GLS2, BID, DPP4, ACVR1B, MIOX, DNAJB6, VEGFA, ACSF2, RIPK1, FADS2 and NFS1. DPH6-DT had coexpressive relationship with ALOX15B, SNX4, BID, PEBP1, MAPK8, VLDLR, ACSF2 and NFS1. LINC00900 was coexpressed with four genes (DUOX1, DUOX2, MAPK14, CD44). LINC01614 was coexpressed with three genes (NOX4, NCF2, NNMT), and PARAL1 was coexpressed with three genes (NCF2, ALOX5, SCD) (Supplementary Material 4, www.wjon.org).
Heat map visualized five ferroptosis-related lncRNAs and clinicopathological variables between high- and low-risk groups
The heat map indicated that LPP-AS2, DPH6-DT, LINC01614 and PARAL1 were highly expressed in the high-risk group, and LINC00900 was upregulated in the low-risk group. Among clinicopathological variables, there were significant differences in T stage and age between high-risk and low-risk groups (Fig. 4).
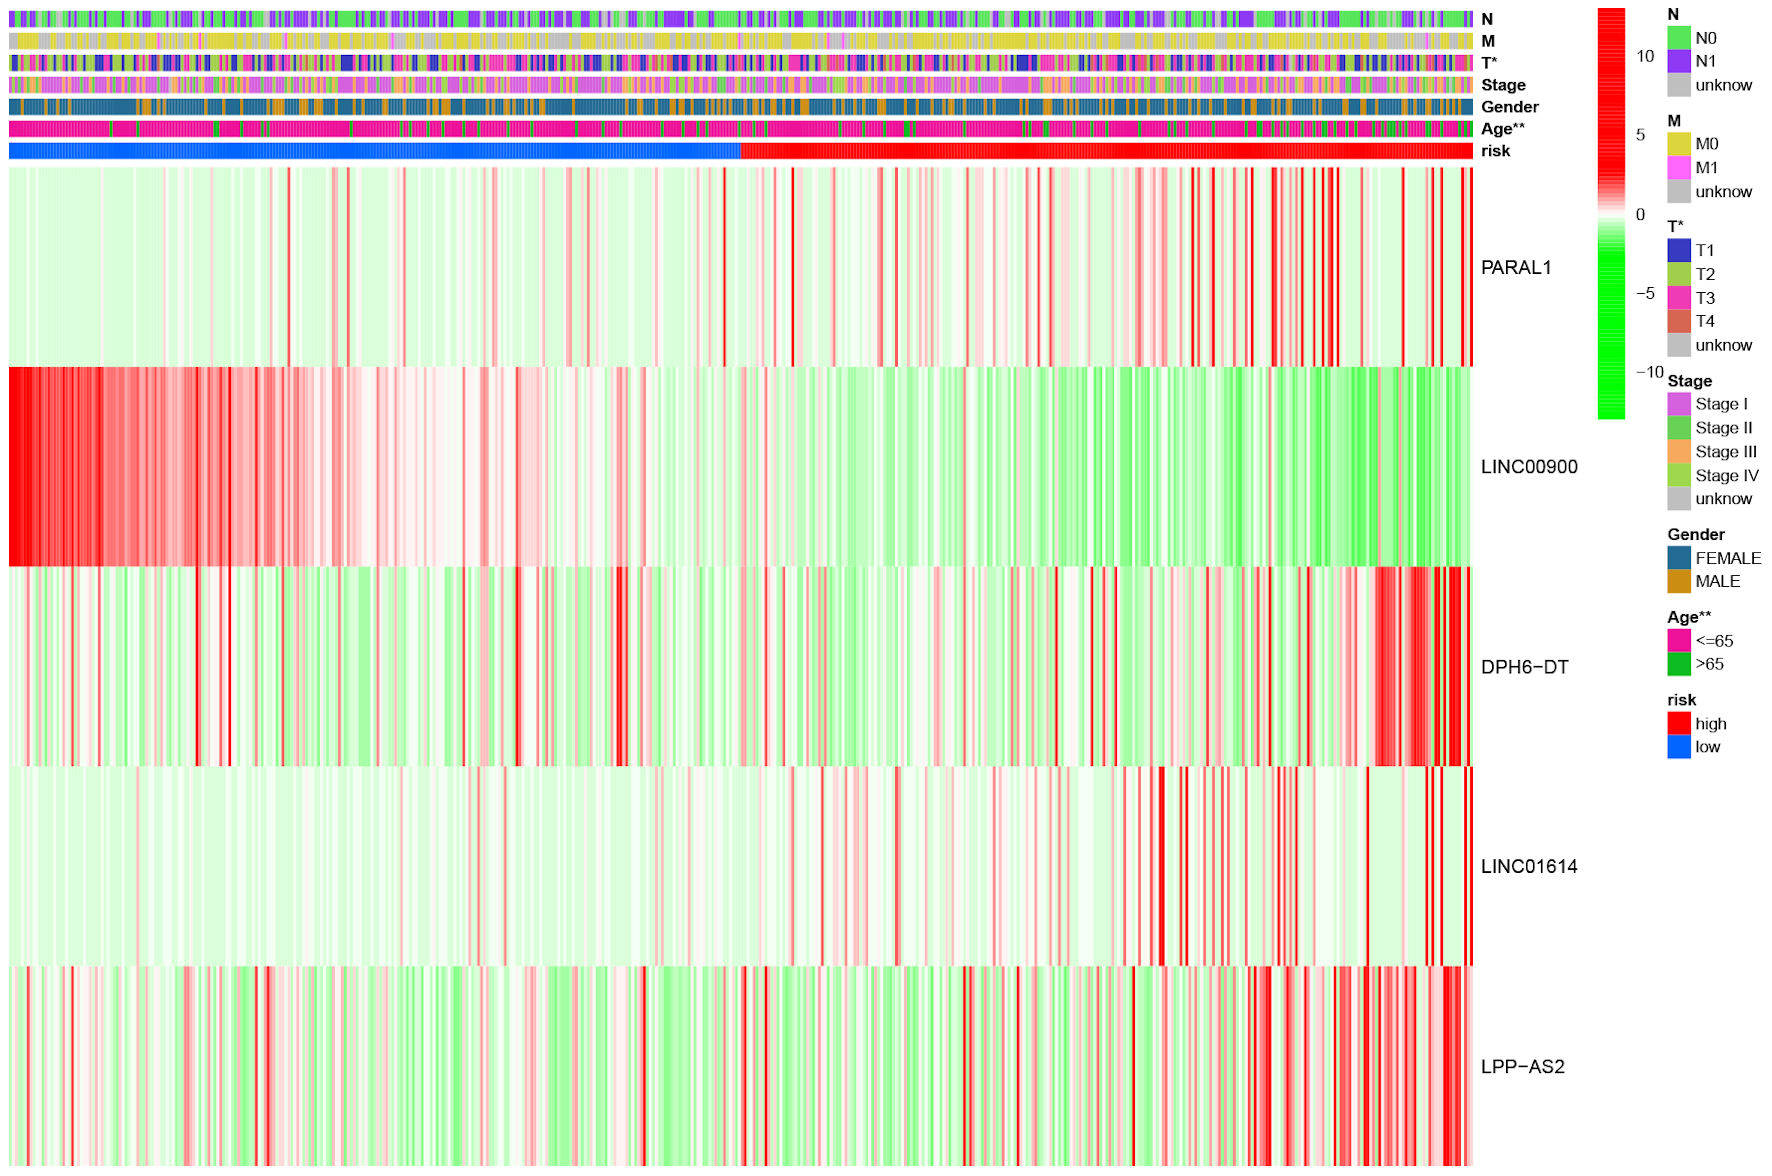 Click for large image | Figure 4. The heat map illustrating the expression of five ferroptosis-related lncRNAs and distribution of clinicopathological variables between high- and low-risk groups. *P < 0.05, **P < 0.01. lncRNA: long non-coding RNA. |
Correlation analysis of risk score with immunity and m6A
Tumor immune microenvironment and m6A-related genes contribute significantly to tumor progression [21-23]. Therefore, to identify whether tumor immune microenvironment and m6A-related genes were different between high- and low-risk groups, we performed the correlation analysis of risk score with immunity and m6A. Differentially infiltrated immune cells were analyzed, and significant differences between the two groups were indicated (Fig. 5a). We then explore the difference in immune function between high- and low-risk groups. Antigen-presenting cell (APC) co-inhibition, APC co-stimulation, chemokine receptor (CCR), checkpoint, human leukocyte antigen (HLA), inflammation-promoting, parainflammation, T cell co-inhibition and type I interferon (IFN) response were significantly different (Fig. 5b). In addition, we also examined immune checkpoints between the two groups, and 27 genes showed significant differences, of which 18 were upregulated in high-risk group. The above results could provide an idea for antitumor immunotherapy (Fig. 5c). The expression of m6A-related genes was detected. Among the 12 genes, five (METTL14, HNRNPC, METTL3, WTAP, YTHDC1) were differentially expressed and all of which were downregulated in high-risk group compared with low-risk group (Fig. 6).
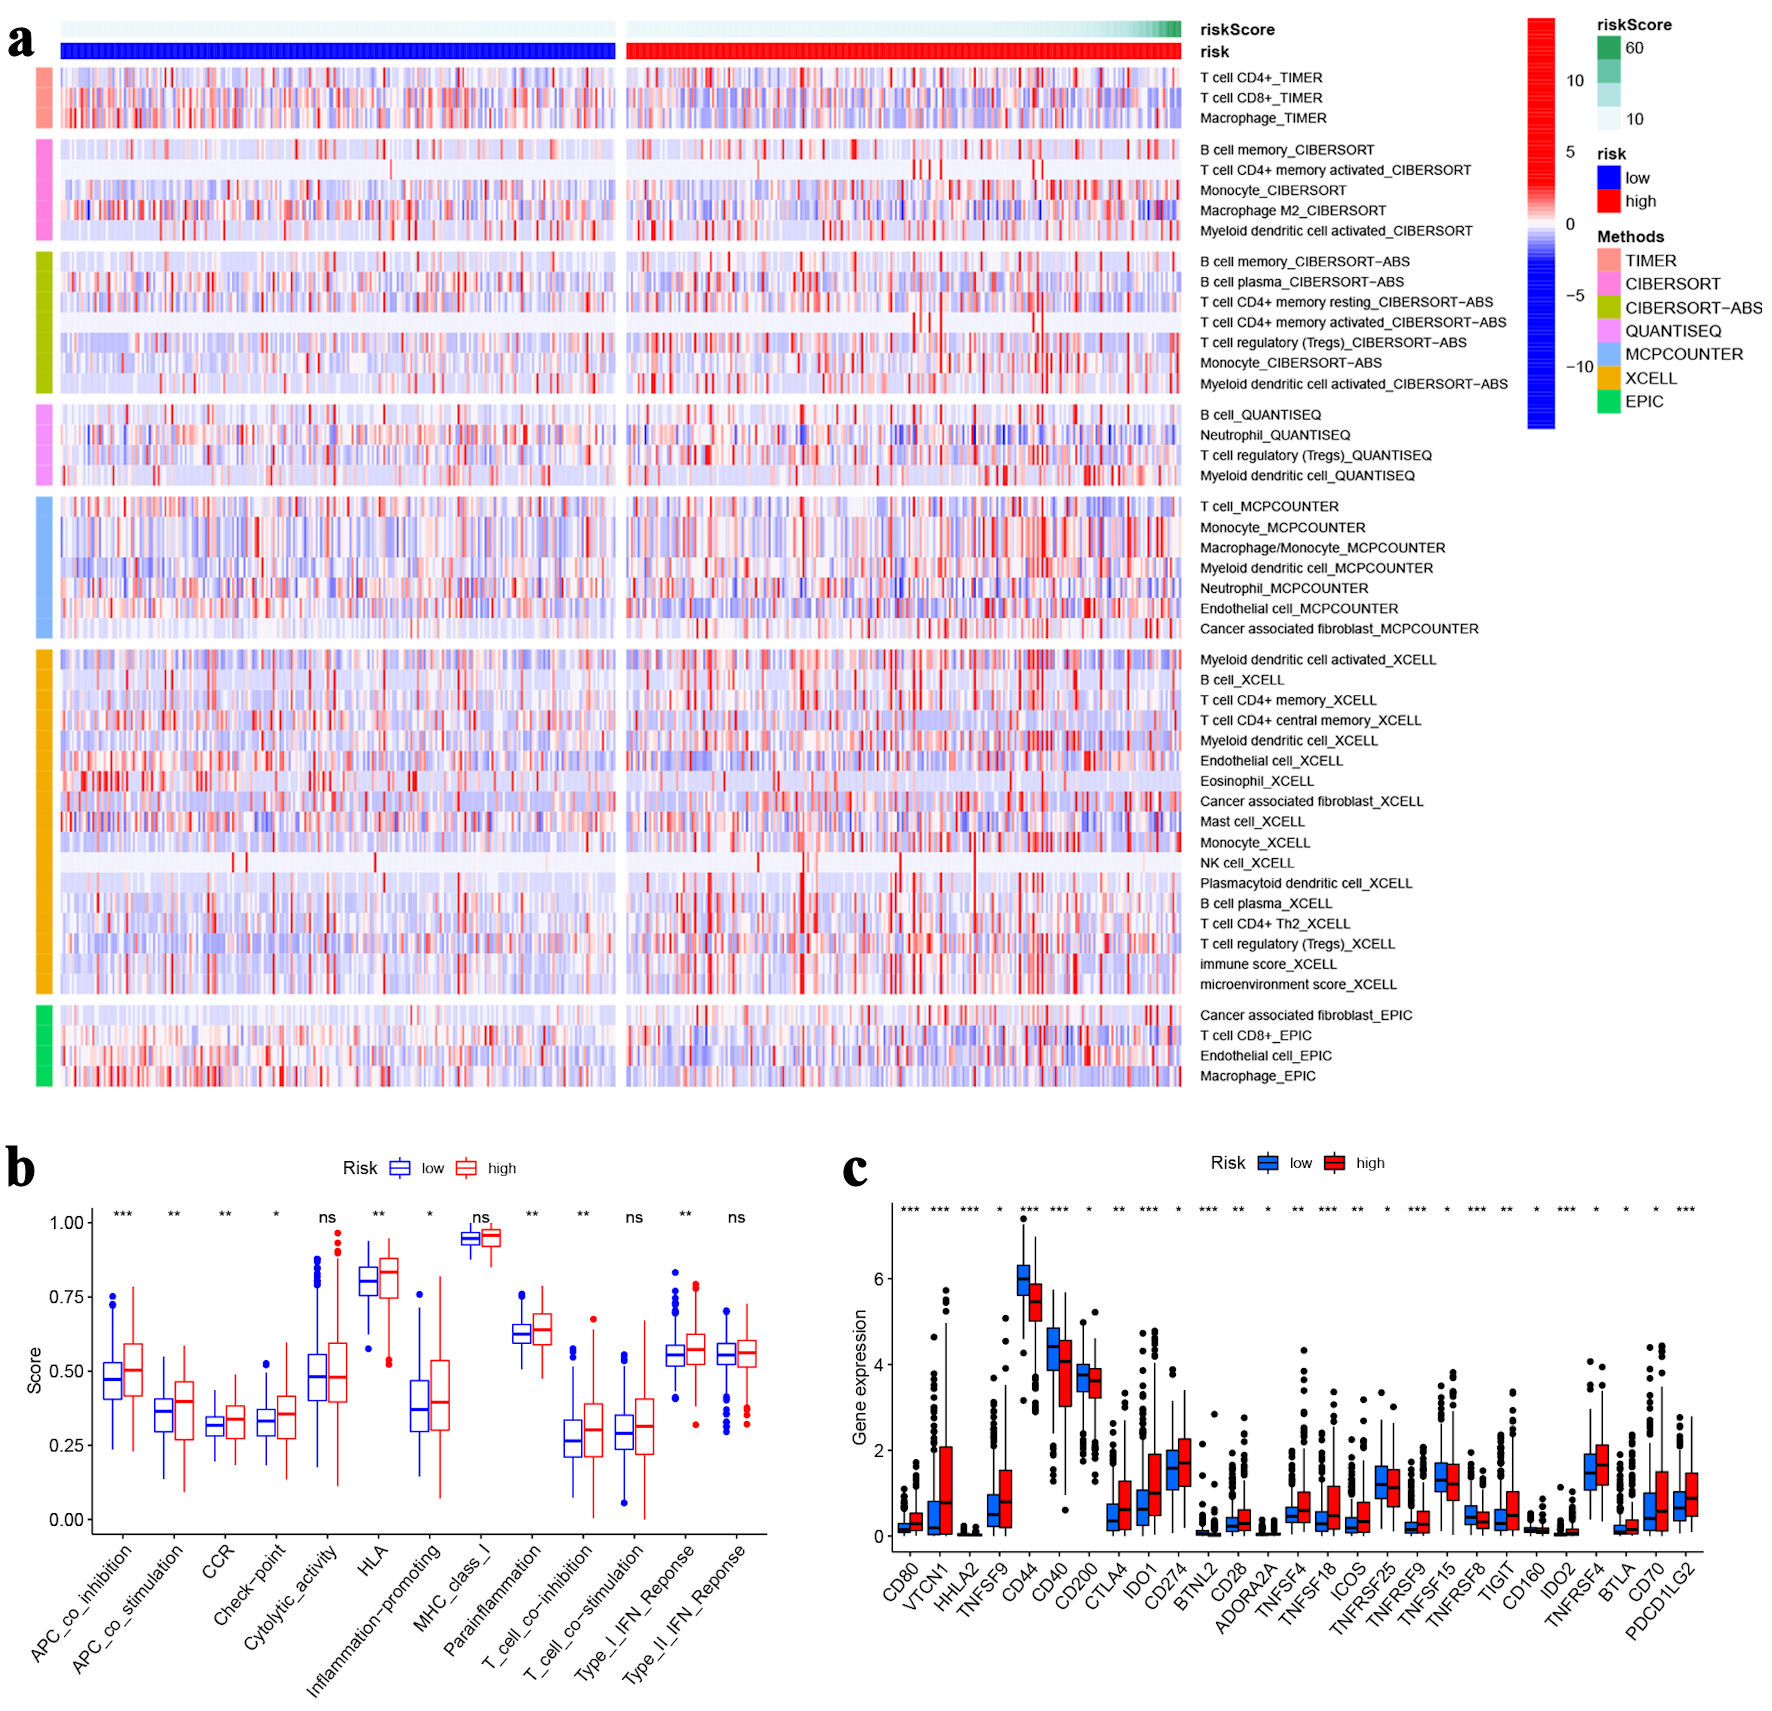 Click for large image | Figure 5. Immune analysis. (a)The heat map visualizing the distribution of immune cells in high- and low-risk groups. (b) Immune function scores between high- and low-risk groups. (c) The expression of immune checkpoint genes in high- and low-risk groups. *P < 0.05, **P < 0.01, ***P < 0.001. |
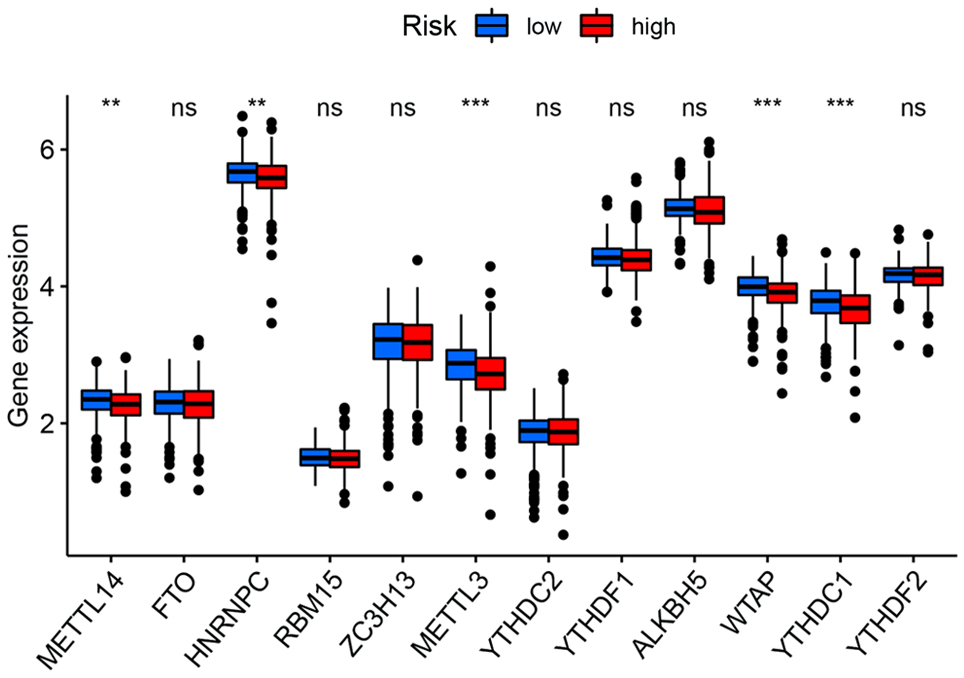 Click for large image | Figure 6. The expression of m6A-related genes between high and low-risk groups. **P < 0.01, ***P < 0.001. |
LINC00900 inhibited proliferation, migration and invasion, while LINC01614 and PARAL1 had the opposite effects
The expression of five ferroptosis-related lncRNAs was examined, PARAL1, LINC00900 and LINC01614 were highly expressed in TPC-1 and BCPAP cells compared with Nthy-ori 3-1 cells (Fig. 7a, b, and d). In contrast, DPH6-DT, LPP-AS2 were poorly expressed (Fig. 7c, e). We then examined the role of three highly expressed lncRNAs in tumor progression. The expression of PARAL1, LINC00900 and LINC01614 were successfully interfered after transfected with siRNA, respectively (Fig. 8a, b). The results of EdU indicated that cell proliferation was increased following LINC00900 knockdown and decreased after downregulation of LINC01614 and PARAL1 (Fig. 8c, d). Transwell results also showed that cell migration and invasion enhanced after silencing LINC00900 expression, while inhibition of LINC01614 and PARAL1 suppressed cell migration and invasion (Fig. 8e, f). The same was true for clone formation assay results (Fig. 8g, h).
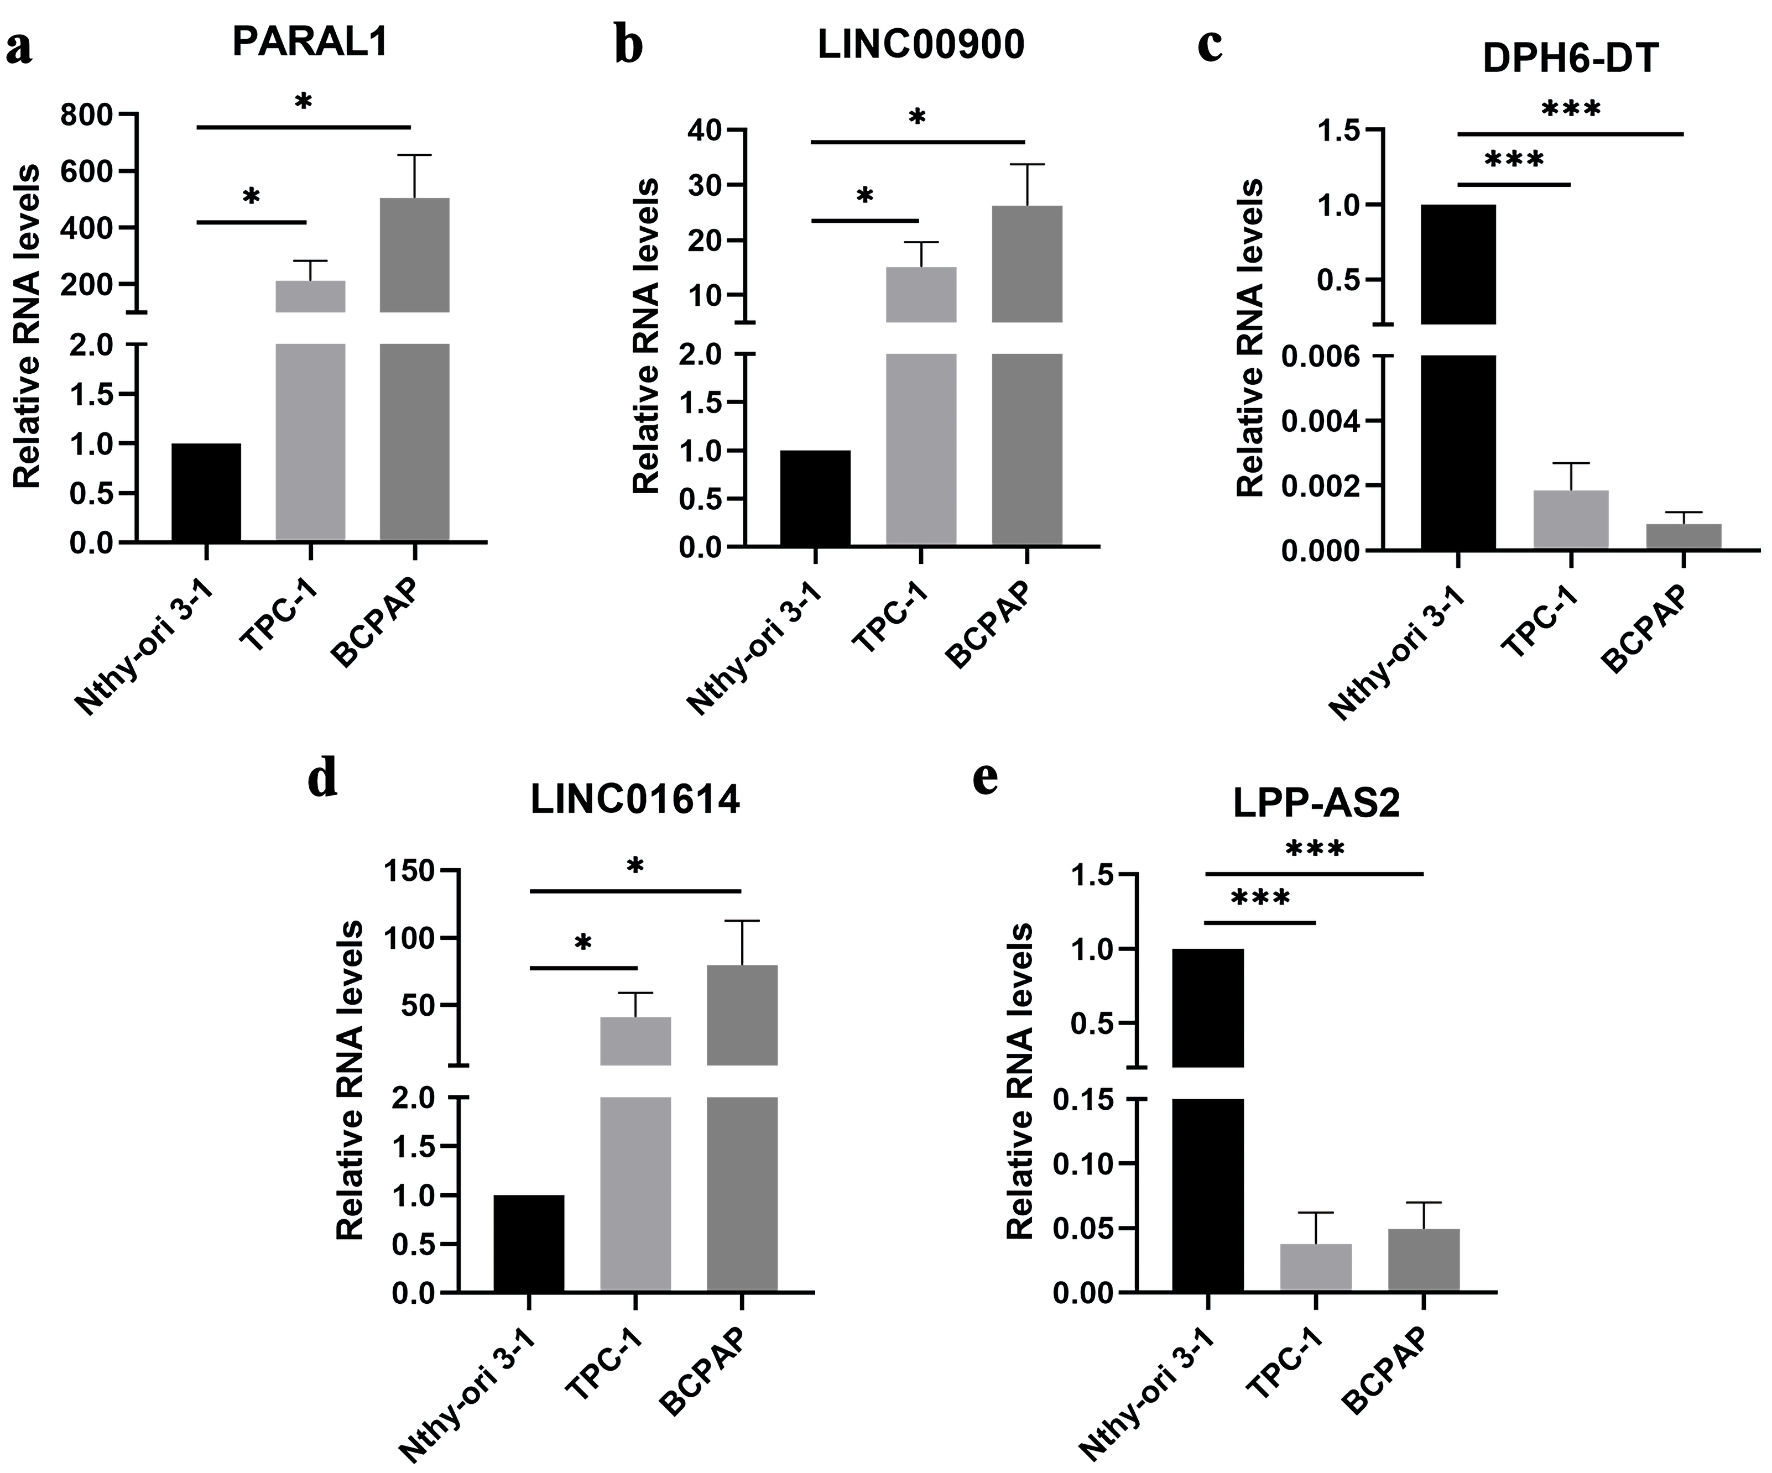 Click for large image | Figure 7. The expression of five ferroptosis-related lncRNAs in Nthy-ori 3-1, TPC-1 and BCPAP cells. Data are presented as mean ± SEM. *P < 0.05, ***P < 0.001. (a) The mRNA expression of PARAL1 in papillary thyroid cancer cell lines. (b) The mRNA expression of LINC00900 in papillary thyroid cancer cell lines. (c) The mRNA expression of DPH6-DT in papillary thyroid cancer cell lines. (d) The mRNA expression of LINC01614 in papillary thyroid cancer cell lines. (e) The mRNA expression of LPP-AS2 in papillary thyroid cancer cell lines. SEM: standard error of the mean. lncRNA: long non-coding RNA. |
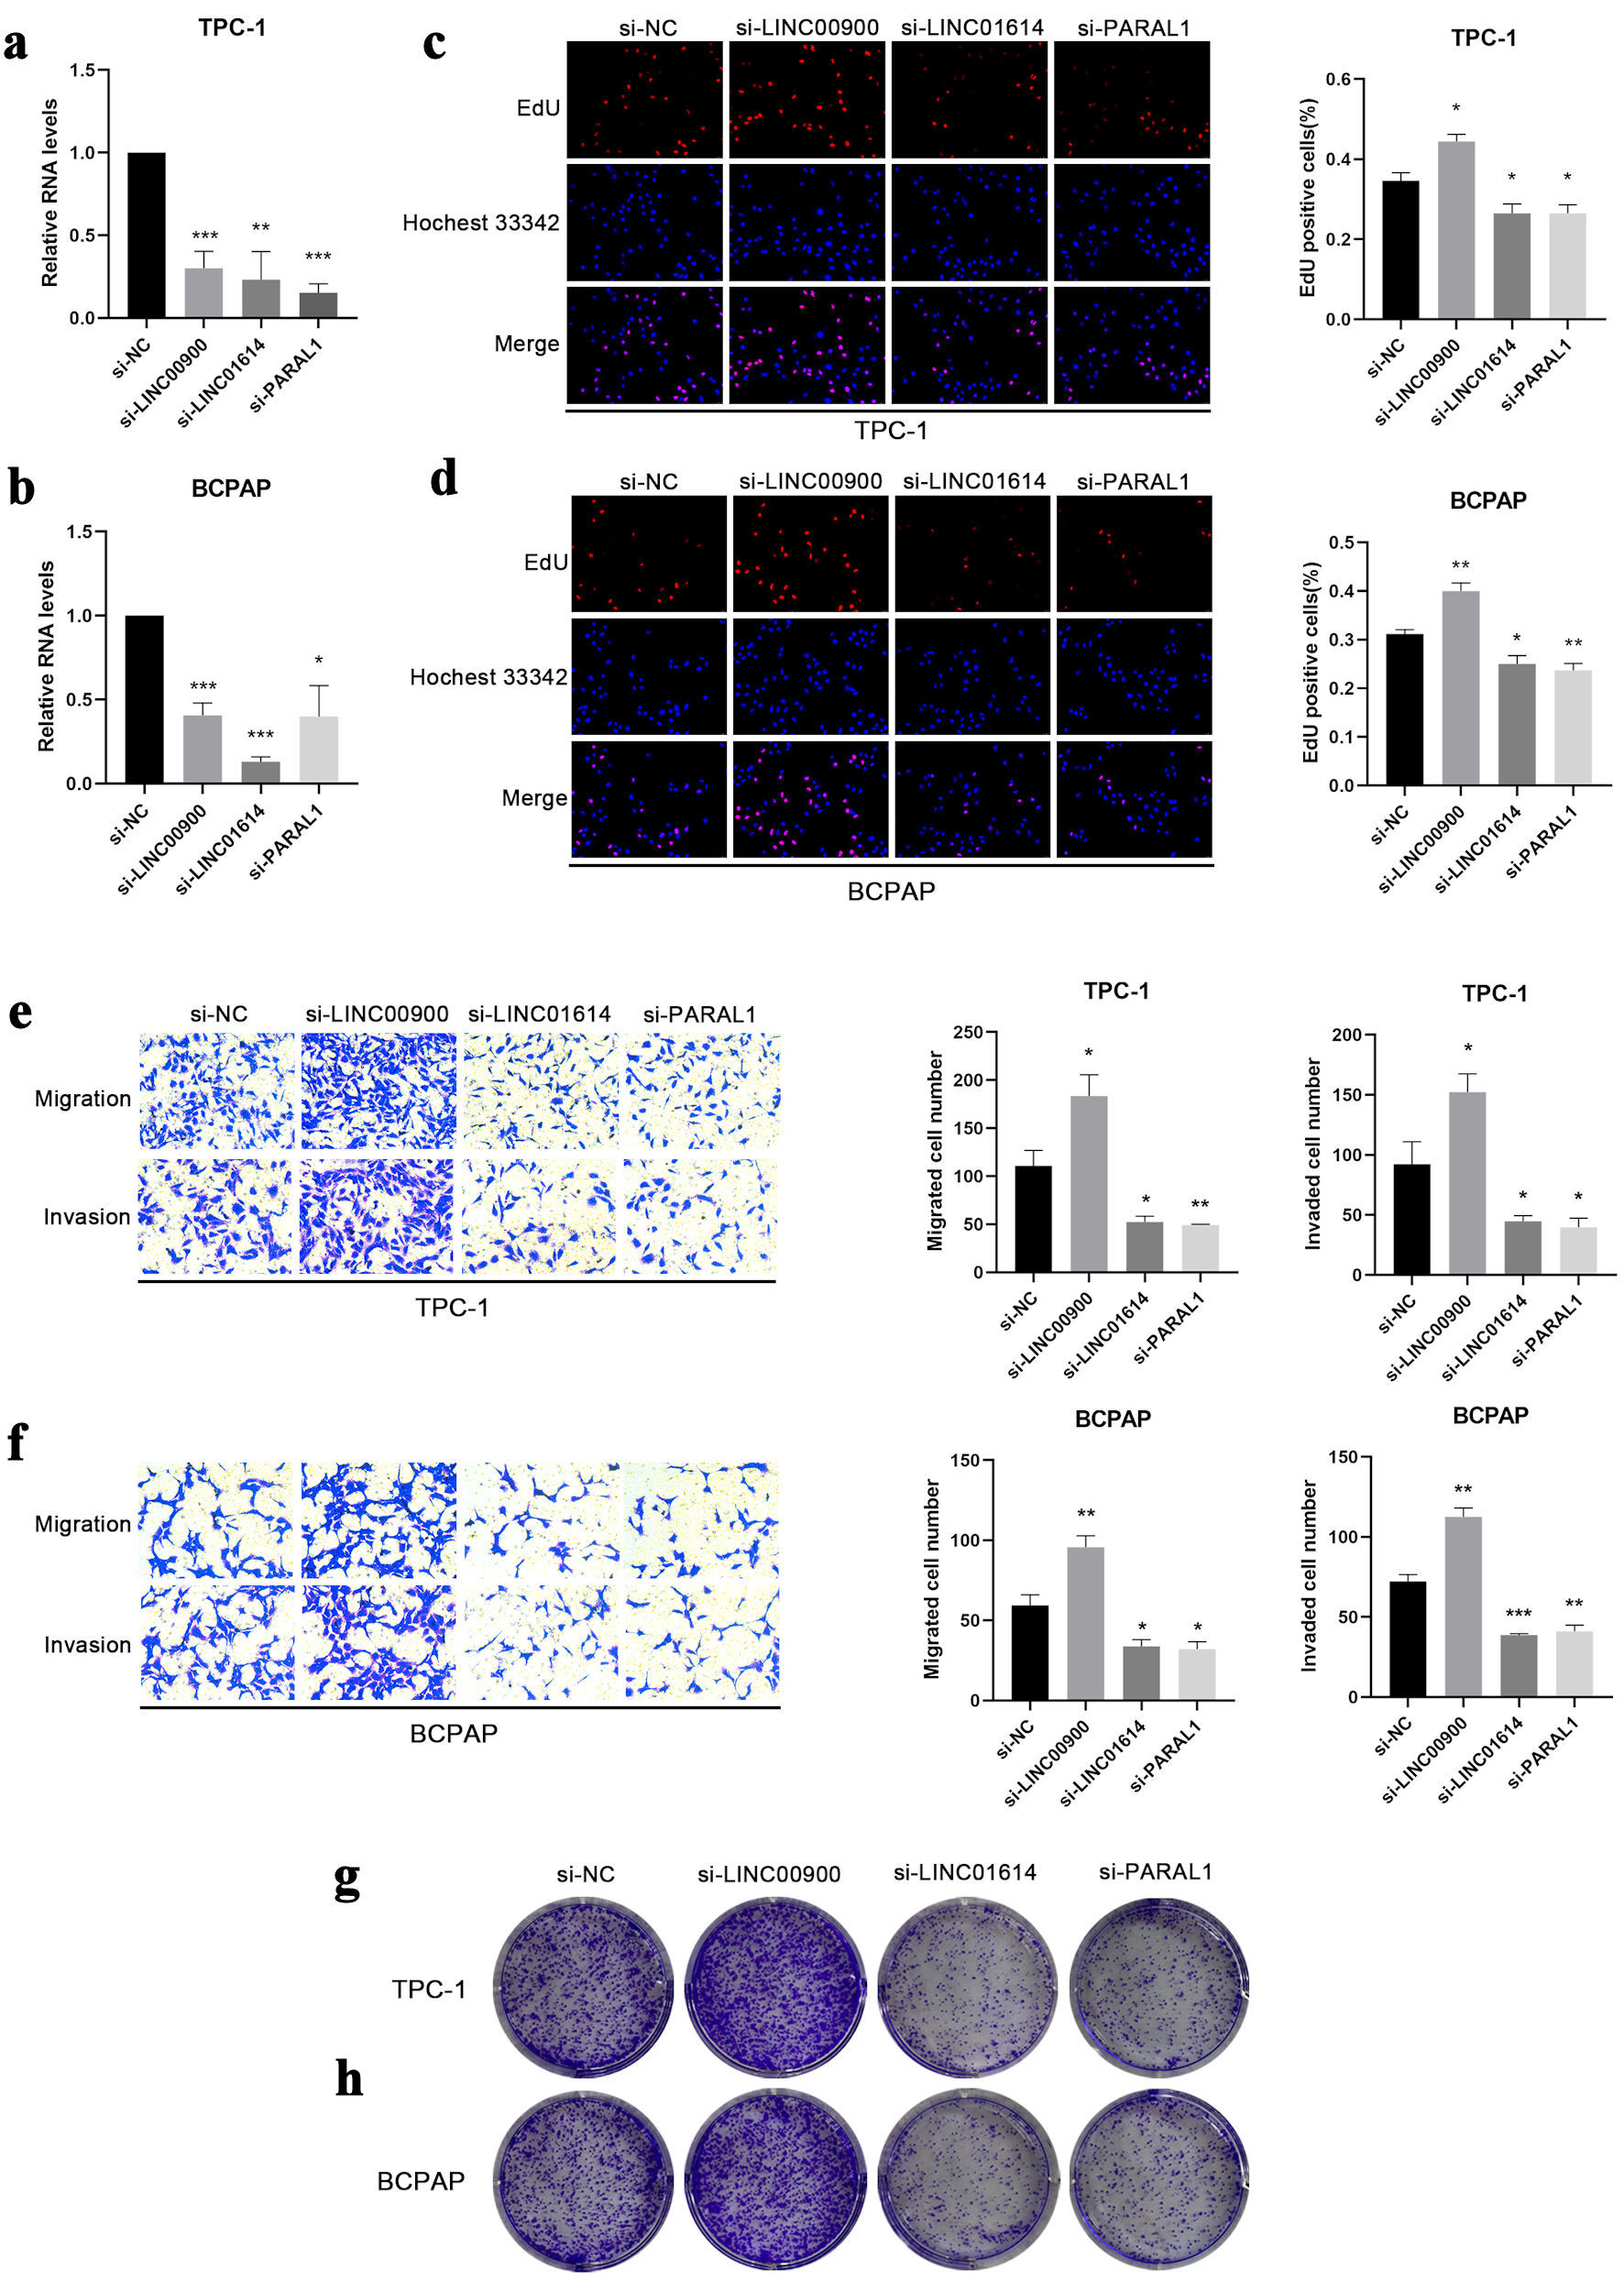 Click for large image | Figure 8. The effect of LINC00900, LINC01614 and PARAL1 on proliferation, colony formation, migration and invasion. (a, b) The expression levels of LINC00900, LINC01614 and PARAL1 after transfected with corresponding siRNA in TPC-1 and BCPAP cells. (c, d) EdU assay illustrating the proliferation of TPC-1 and BCPAP cells following knockdown of LINC00900, LINC01614 and PARAL1. The proliferating cell nuclei were stained with EdU (red), all nuclei were stained with Hoechst 33342 (blue). (e, f) The migration and invasion of TPC-1 and BCPAP cells after suppressing the expression of LINC00900, LINC01614 and PARAL1. (g, h) Cellular clonogenic potential was detected by colony formation assay in TPC-1 and BCPAP cells. Data are presented as mean ± SEM. *P < 0.05, **P < 0.01, ***P < 0.001. SEM: standard error of the mean. |
LINC00900, LINC01614 and PARAL1 were involved in ferroptosis
Given that these five lncRNAs are ferroptosis-related lncRNAs, content of Fe2+ was determined by enzyme-linked immunosorbent assay (ELISA). The results showed that the content of Fe2+ decreased after downregulation of LINC00900 but increased after inhibiting the expression of PARAL1 and LINC01614 (Fig. 9a, b). The expression of ACSL4 and GPX4 protein was subsequently detected. LINC00900 knockdown reduced the expression of ACSL4, accompanied by GPX4 expression increased. Interfering with PARAL1 and LINC01614 exhibited reverse outcomes (Fig. 9c, d).
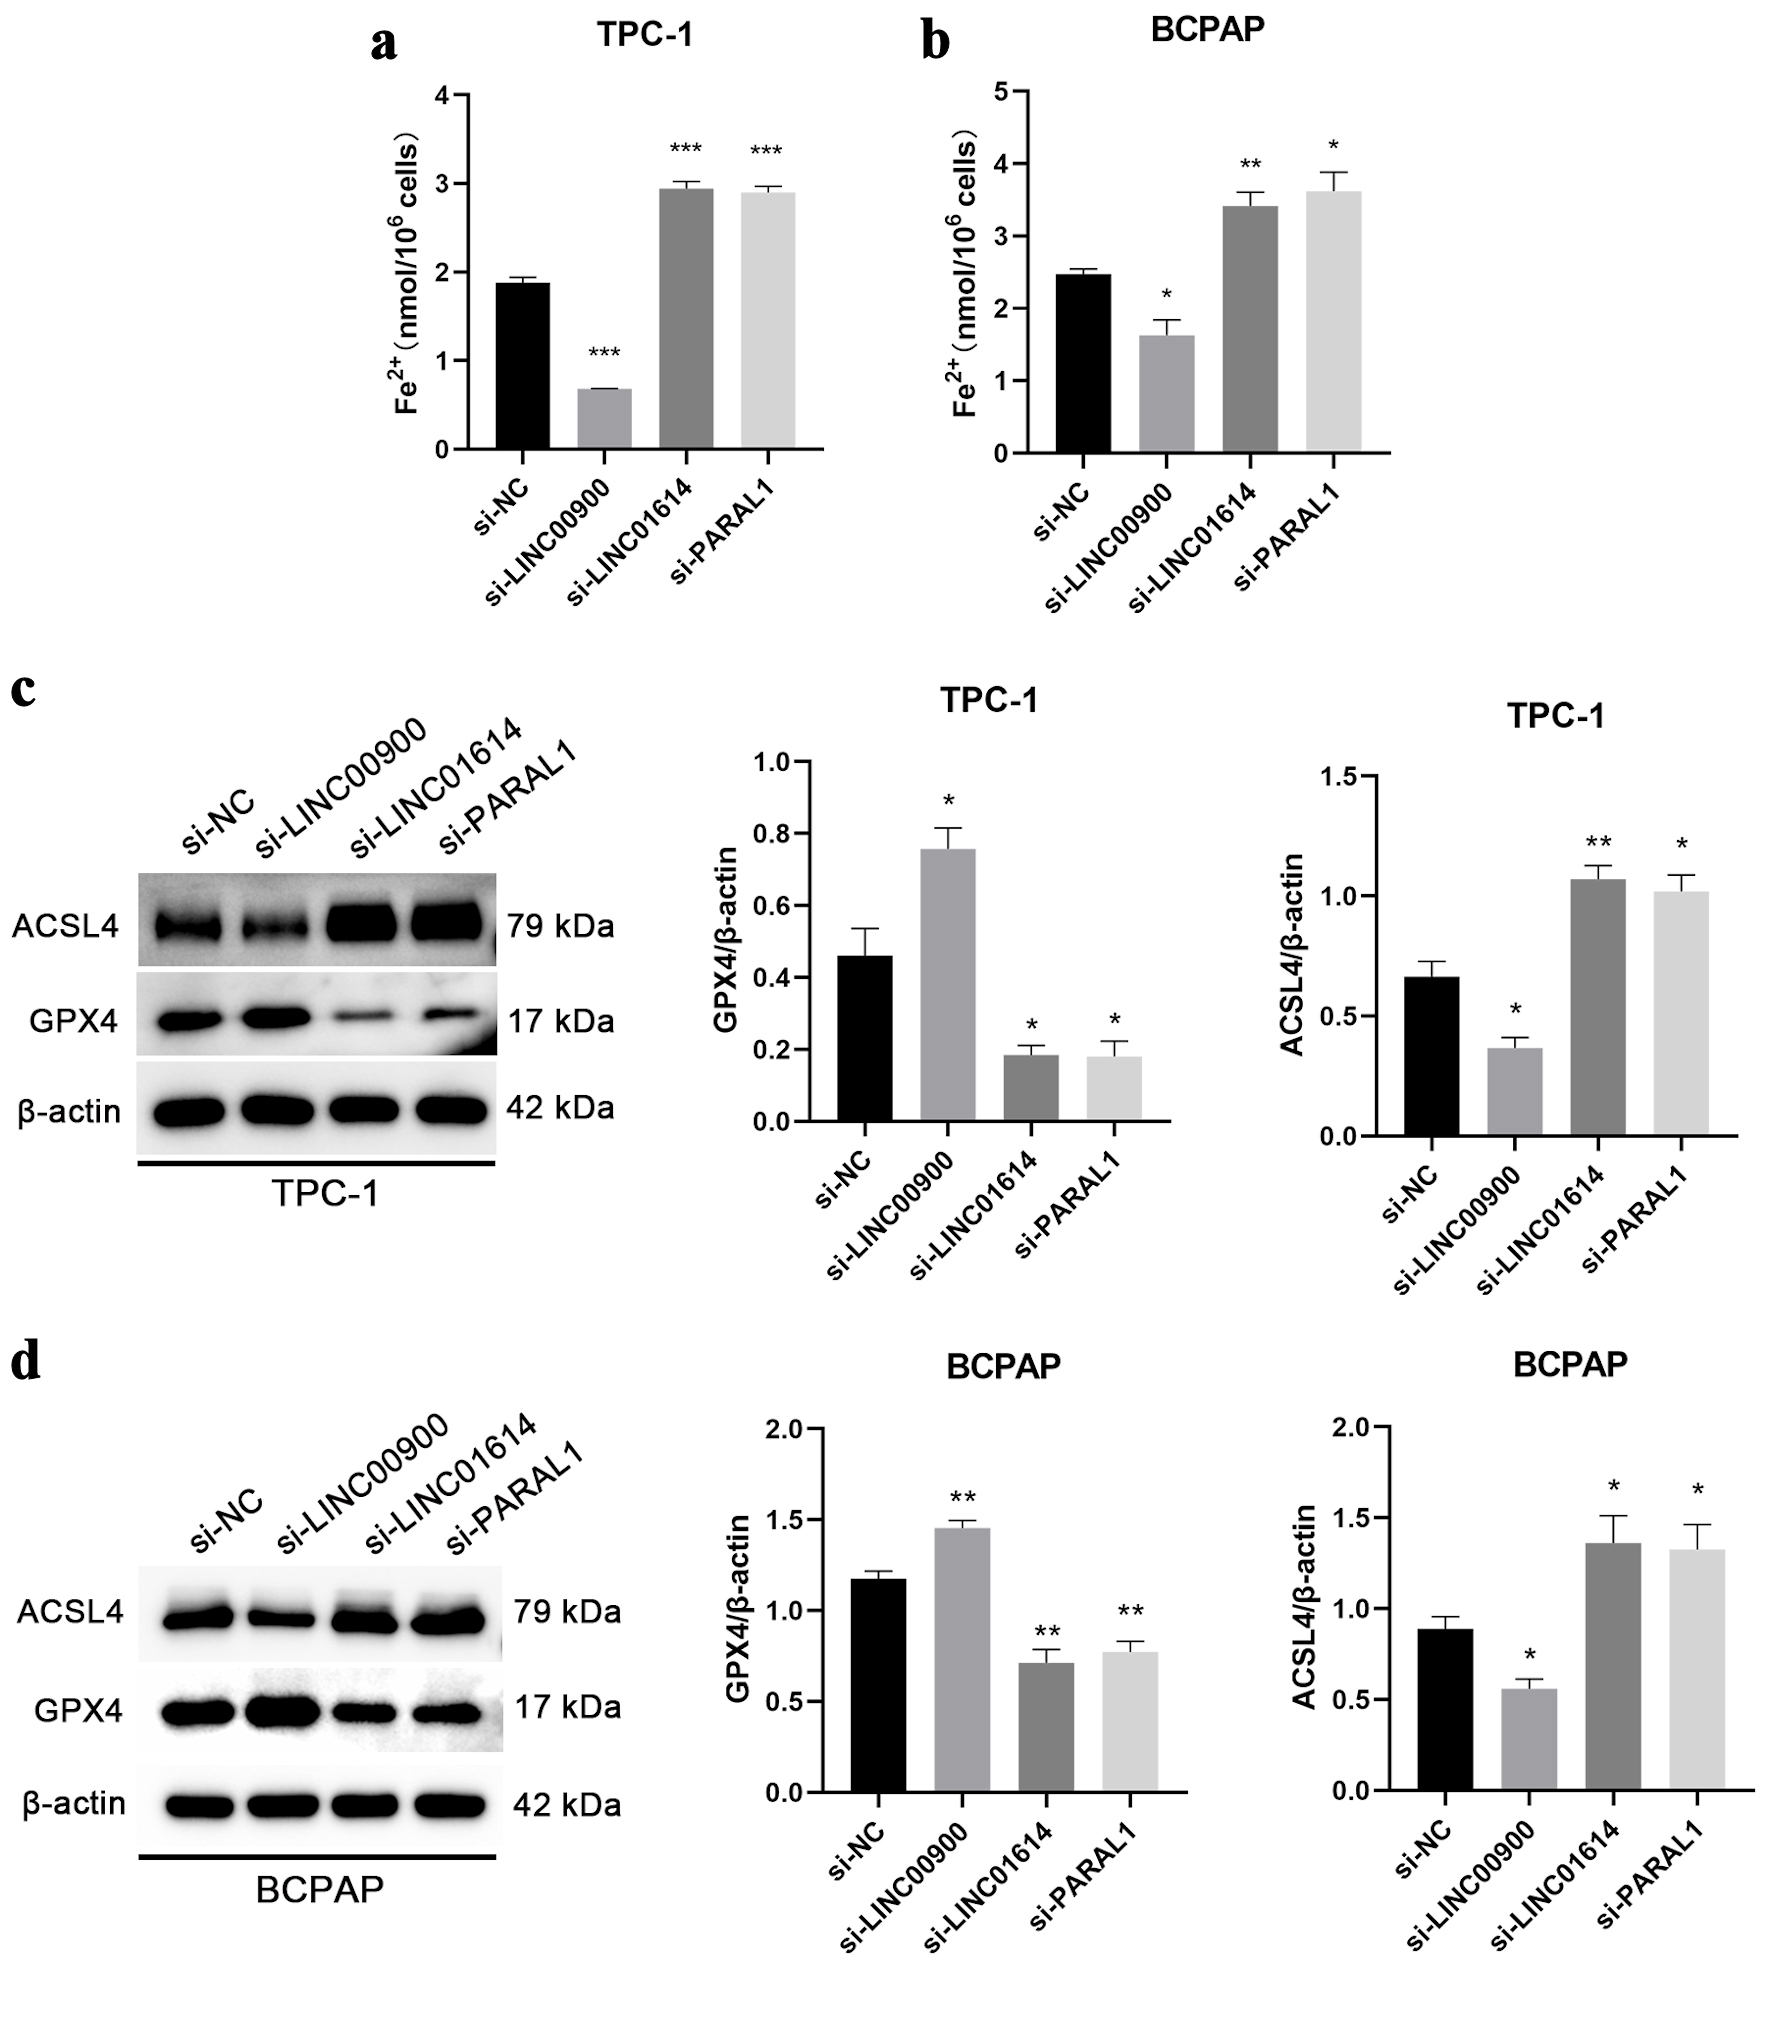 Click for large image | Figure 9. The correlations between LINC00900, LINC01614, PARAL1 and ferroptosis. (a, b) Content of Fe2+ in TPC-1 and BCPAP cells with downregulation of LINC00900, LINC01614 and PARAL1. (c, d) The protein levels of ASCL4 and GPX4 after silencing the expression of LINC00900, LINC01614 and PARAL1. Data are presented as mean ± SEM. *P < 0.05, **P < 0.01, ***P < 0.001. SEM: standard error of the mean. |
| Discussion | ▴Top |
In current research, ferroptosis appears to play an important role in cancer progression. Ferroptosis-related lncRNAs for predicting prognosis have been reported in many cancers [24, 25]. However, ferroptosis-related lncRNAs prognostic model for PTC remains to be elucidated.
First, a total of 29 ferroptosis-related DEGs were obtained. Among enriched KEGG pathways, arachidonic acid biosynthesis pathway plays an essential role in ferroptosis in gastric cancer cells [26]. Central carbon metabolism includes glycolysis, the pentose phosphate pathway, and the tricarboxylic acid cycle [27]. α-enolase 1 (ENO1), a critical glycolytic enzyme, inhibits cancer cell ferroptosis through degrading the mRNA of iron regulatory protein 1 [28].
Recent studies have indicated ferroptosis-related lncRNAs for predicting the prognosis of hepatocellular cancer, bladder cancer and renal cell carcinoma [29-31]. In addition, the prognosis of PTC patients has also been predicted with lncRNA-associated signatures. Genomic instability-related lncRNA signature has been developed to predict the prognosis of PTC [32]. A nine-autophagy-related lncRNA prognostic risk model was established for thyroid cancer [33]. Recent study indicated that the ferroptosis-related lncRNA pairs model showed good predictive value for the prognosis of patients with PTC [34]. We identified five ferroptosis-related lncRNAs by multivariate Cox proportional hazards regression analysis, several of which have been confirmed in previous studies. A recent study suggested that knockdown of DPH6-DT enhanced cell proliferation, invasion and migration via PI3K-AKT signal pathway [35]. LPP-AS2 functions as a ceRNA by sponging miR-7-5p to promote glioma tumorigenesis [36].
Increasing evidence demonstrates that ferroptosis is increasingly linked to tumor progression. Ferroptosis effectively suppresses tumor growth [37, 38]. A close relationship exists between the tumor suppressor p53 and ferroptosis [39, 40]. p53 represses transcription of solute carrier family 7 member 11(SLC7A11) by binding the promoter region of the gene, and further enhances ferroptosis [40]. SLC7A11, a key transporter of cystine, mediates antioxidant defense to suppress ferroptosis. Considering the widespread presence of p53 mutations in cancers [41], ferroptosis may play an essential role in alleviating tumor progression. The role of ferroptosis was also observed in thyroid cancer. Wang et al suggested that circ_0067934 inhibited ferroptosis through miR-545-3p/SLC7A11 signaling, and further contributed to cell proliferation of thyroid cancer [42]. Fat mass and obesity-associated protein suppresses progression of PTC via m6A methylation of SLC7A11 in a ferroptosis-dependent manner [43].
Previous studies have shown that ferroptosis is associated with immune. Supernatants of activated CD8+ T cells decreased SLC7A11 expression in HT-1080 cells, and cell death induced by erastin, a ferroptosis activator, enhanced following knockdown of SLC7A11 [44], which was consistent with our results that CD8+ T cells was upregulated in low-risk groups. Additionally, 1-steaoryl-2-15-HpETE-sn-glycero-3-phosphatidylethanolamine (SAPE-OOH) on the surface of ferroptotic cells can be recognized by Toll-like receptor 2 (TLR2) on macrophages, resulting in clearance of ferroptotic cells [45].
We experimentally validated that LINC00900 inhibited proliferation, migration and invasion of TPC-1 and BCPAP cells, while LINC01614 and PARAL1 enhanced that of cells. Recent studies have shown that LINC01614 contributes to osteosarcoma progression through miR-520a-3p/SNX3 axis [46]. Furthermore, LINC01614 downregulation suppressed the development of lung adenocarcinoma by increasing the expression of miR-217 and downregulating FOXP1[47].
There are a few limitations in this study. First, only the role of three lncRNAs which highly expressed in PTC cells on proliferation, migration and invasion were verified. In addition, the mechanism of action was not elucidated. Moreover, further validations are required in clinical samples. In the following study, a more in-depth study should be carried out.
Conclusions
In conclusion, a novel five-ferroptosis-related lncRNA model was established to predict the prognosis and immune response of PTC patients. Clinicopathological variables were also correlated with this model. Our study further verified that LINC00900 was a tumor suppressor lncRNA, LINC01614 and PARAL1 acted as an oncogenic lncRNA. In summary, our results may provide novel insight for the treatment regimens of PTC patients.
| Supplementary Material | ▴Top |
Suppl 1. KEGG and GO enrichment analysis of ferroptosis-related DEGs. (A) KEGG enrichment analysis of ferroptosis-related DEGs. (B) GO enrichment analysis of ferroptosis-related DEGs.
Suppl 2. The expression of each gene associated with overall survival in the TCGA data. (A) PARAL1. (B) LINC00900. (C) DPH6-DT. (D) LINC01614. (E) LPP-AS2.
Suppl 3. Distribution of risk score and survival time in patients between high- and low-risk groups. (A) Distribution of risk score in patients between high- and low-risk groups. (B) Survival time of patients with different risk score.
Suppl 4. The coexpression network between five ferroptosis-related lncRNAs and mRNA.
Acknowledgments
None to declare.
Financial Disclosure
This work was supported by the National Natural Science Foundation of China (grant number 82303031), Shandong Provincial Natural Science Foundation of China Grants (grant number ZR2019PH025), Projects of medical and health technology development program in Shandong province (grant number 2016WS0499), Bethune Public Welfare Foundation (grant number Z04JKM2022E036), and Scientific Research Nurturing Fund of the First Affiliated Hospital of Shandong First Medical University & Shandong Provincial Qianfoshan Hospital (grant number QYPY2023NSFC0601).
Conflict of Interest
The authors declare that they have no conflict of interest to declare.
Informed Consent
Not applicable.
Author Contributions
JYZ, JMY, LL and JJD conceived and designed the study. JYZ and JMY collected and analyzed the data. In vitro assays were performed by JYZ, JMY, XZZ, KLW, SJ, SYG and QQS. Finally, JYZ and JMY were the major contributors in writing the manuscript. LL and JJD supervised the whole study and revised the manuscript. All authors read and approved the final manuscript.
Data Availability
The datasets generated and/or analyzed during the current study are available in The Cancer Genome Atlas (TCGA) database. The research data form in vitro assays could be provided by contacting corresponding author on reasonable request if necessary.
| References | ▴Top |
- Prete A, Borges de Souza P, Censi S, Muzza M, Nucci N, Sponziello M. Update on fundamental mechanisms of thyroid cancer. Front Endocrinol (Lausanne). 2020;11:102.
doi pubmed pmc - Choi YS, Choi SW, Yi JW. Prospective Analysis of TERT Promoter Mutations in Papillary Thyroid Carcinoma at a Single Institution. J Clin Med. 2021;10(10):2179.
doi pubmed pmc - Shi J, Wu P, Sheng L, Sun W, Zhang H. Ferroptosis-related gene signature predicts the prognosis of papillary thyroid carcinoma. Cancer Cell Int. 2021;21(1):669.
doi pubmed pmc - Chen X, Li J, Kang R, Klionsky DJ, Tang D. Ferroptosis: machinery and regulation. Autophagy. 2021;17(9):2054-2081.
doi pubmed pmc - Li C, Zhang Y, Liu J, Kang R, Klionsky DJ, Tang D. Mitochondrial DNA stress triggers autophagy-dependent ferroptotic death. Autophagy. 2021;17(4):948-960.
doi pubmed pmc - Yang WS, SriRamaratnam R, Welsch ME, Shimada K, Skouta R, Viswanathan VS, Cheah JH, et al. Regulation of ferroptotic cancer cell death by GPX4. Cell. 2014;156(1-2):317-331.
doi pubmed pmc - Chen H, Cao L, Han K, Zhang H, Cui J, Ma X, Zhao S, et al. Patulin disrupts SLC7A11-cystine-cysteine-GSH antioxidant system and promotes renal cell ferroptosis both in vitro and in vivo. Food Chem Toxicol. 2022;166:113255.
doi pubmed - Greenshields AL, Shepherd TG, Hoskin DW. Contribution of reactive oxygen species to ovarian cancer cell growth arrest and killing by the anti-malarial drug artesunate. Mol Carcinog. 2017;56(1):75-93.
doi pubmed - Basuli D, Tesfay L, Deng Z, Paul B, Yamamoto Y, Ning G, Xian W, et al. Iron addiction: a novel therapeutic target in ovarian cancer. Oncogene. 2017;36(29):4089-4099.
doi pubmed pmc - Eling N, Reuter L, Hazin J, Hamacher-Brady A, Brady NR. Identification of artesunate as a specific activator of ferroptosis in pancreatic cancer cells. Oncoscience. 2015;2(5):517-532.
doi pubmed pmc - Buccarelli M, Marconi M, Pacioni S, De Pascalis I, D'Alessandris QG, Martini M, Ascione B, et al. Inhibition of autophagy increases susceptibility of glioblastoma stem cells to temozolomide by igniting ferroptosis. Cell Death Dis. 2018;9(8):841.
doi pubmed pmc - Hu R, Shi Z, Yang J, Ren Y, Li X. Anti-ferroptosis: a promising therapeutic method for thyroid cancer. Front Biosci (Landmark Ed). 2024;29(2):77.
doi pubmed - Lin W, Zhou Q, Wang CQ, Zhu L, Bi C, Zhang S, Wang X, et al. LncRNAs regulate metabolism in cancer. Int J Biol Sci. 2020;16(7):1194-1206.
doi pubmed pmc - Peng WX, Koirala P, Mo YY. LncRNA-mediated regulation of cell signaling in cancer. Oncogene. 2017;36(41):5661-5667.
doi pubmed pmc - Bach DH, Lee SK. Long noncoding RNAs in cancer cells. Cancer Lett. 2018;419:152-166.
doi pubmed - Shi H, Xu Y, Yi X, Fang D, Hou X. Current research progress on long noncoding RNAs associated with hepatocellular carcinoma. Anal Cell Pathol (Amst). 2019;2019:1534607.
doi pubmed pmc - Oncul S, Amero P, Rodriguez-Aguayo C, Calin GA, Sood AK, Lopez-Berestein G. Long non-coding RNAs in ovarian cancer: expression profile and functional spectrum. RNA Biol. 2020;17(11):1523-1534.
doi pubmed pmc - Liu H, Deng H, Zhao Y, Li C, Liang Y. LncRNA XIST/miR-34a axis modulates the cell proliferation and tumor growth of thyroid cancer through MET-PI3K-AKT signaling. J Exp Clin Cancer Res. 2018;37(1):279.
doi pubmed pmc - Huang T, Guan S, Wang C. CERS6-AS1 facilitates oncogenesis and restrains ferroptosis in papillary thyroid carcinoma by serving as a ceRNA through miR-497-5p/LASP1 axis. Ann Clin Lab Sci. 2022;52(3):426-438.
pubmed - Zhou N, Yuan X, Du Q, Zhang Z, Shi X, Bao J, Ning Y, et al. FerrDb V2: update of the manually curated database of ferroptosis regulators and ferroptosis-disease associations. Nucleic Acids Res. 2023;51(D1):D571-D582.
doi pubmed pmc - Cao LL, Kagan JC. Targeting innate immune pathways for cancer immunotherapy. Immunity. 2023;56(10):2206-2217.
doi pubmed pmc - Kao KC, Vilbois S, Tsai CH, Ho PC. Metabolic communication in the tumour-immune microenvironment. Nat Cell Biol. 2022;24(11):1574-1583.
doi pubmed - An Y, Duan H. The role of m6A RNA methylation in cancer metabolism. Mol Cancer. 2022;21(1):14.
doi pubmed pmc - Xiao S, Liu X, Yuan L, Wang F. A ferroptosis-related lncRNAs signature predicts prognosis and therapeutic response of gastric cancer. Front Cell Dev Biol. 2021;9:736682.
doi pubmed pmc - Zheng J, Guo J, Wang Y, Zheng Y, Zhang K, Tong J. Bioinformatic analyses of the ferroptosis-related lncRNAs signature for ovarian cancer. Front Mol Biosci. 2021;8:735871.
doi pubmed pmc - Lee JY, Nam M, Son HY, Hyun K, Jang SY, Kim JW, Kim MW, et al. Polyunsaturated fatty acid biosynthesis pathway determines ferroptosis sensitivity in gastric cancer. Proc Natl Acad Sci U S A. 2020;117(51):32433-32442.
doi pubmed pmc - Zou W, Al-Rubeai M. Understanding central carbon metabolism of rapidly proliferating mammalian cells based on analysis of key enzymatic activities in GS-CHO cell lines. Biotechnol Appl Biochem. 2016;63(5):642-651.
doi pubmed - Zhang T, Sun L, Hao Y, Suo C, Shen S, Wei H, Ma W, et al. ENO1 suppresses cancer cell ferroptosis by degrading the mRNA of iron regulatory protein 1. Nat Cancer. 2022;3(1):75-89.
doi pubmed - Xu Z, Peng B, Liang Q, Chen X, Cai Y, Zeng S, Gao K, et al. Construction of a ferroptosis-related nine-lncRNA signature for predicting prognosis and immune response in hepatocellular carcinoma. Front Immunol. 2021;12:719175.
doi pubmed pmc - Chen M, Nie Z, Li Y, Gao Y, Wen X, Cao H, Zhang S. A new ferroptosis-related lncRNA signature predicts the prognosis of bladder cancer patients. Front Cell Dev Biol. 2021;9:699804.
doi pubmed pmc - Lai J, Miao S, Ran L. Ferroptosis-associated lncRNA prognostic signature predicts prognosis and immune response in clear cell renal cell carcinoma. Sci Rep. 2023;13(1):2114.
doi pubmed pmc - Dong X, Jin C, Chen D, Chen Y, Ye ZQ, Zhang X, Huang X, et al. Genomic instability-related LncRNA signature predicts the prognosis and highlights LINC01614 is a tumor microenvironment-related oncogenic lncRNA of papillary thyroid carcinoma. Front Oncol. 2021;11:737867.
doi pubmed pmc - Shan Y, He R, Yang X, Zang S, Yao S, Gao M, Li S, et al. An autophagy-related lncRNA prognostic risk model for thyroid cancer. Eur Arch Otorhinolaryngol. 2022;279(3):1621-1631.
doi pubmed - Xiao W, Lai Y, Yang H, Que H. Predictive role of a novel ferroptosis-related lncRNA pairs model in the prognosis of papillary thyroid carcinoma. Biochem Genet. 2024;62(2):775-797.
doi pubmed - Wang W, Bai N, Li X. Comprehensive analysis of the prognosis and drug sensitivity of differentiation-related lncRNAs in papillary thyroid cancer. Cancers (Basel). 2022;14(5):1353.
doi pubmed pmc - Zhang X, Niu W, Mu M, Hu S, Niu C. Long non-coding RNA LPP-AS2 promotes glioma tumorigenesis via miR-7-5p/EGFR/PI3K/AKT/c-MYC feedback loop. J Exp Clin Cancer Res. 2020;39(1):196.
doi pubmed pmc - Xu T, Ding W, Ji X, Ao X, Liu Y, Yu W, Wang J. Molecular mechanisms of ferroptosis and its role in cancer therapy. J Cell Mol Med. 2019;23(8):4900-4912.
doi pubmed pmc - Friedmann Angeli JP, Krysko DV, Conrad M. Ferroptosis at the crossroads of cancer-acquired drug resistance and immune evasion. Nat Rev Cancer. 2019;19(7):405-414.
doi pubmed - Kang R, Kroemer G, Tang D. The tumor suppressor protein p53 and the ferroptosis network. Free Radic Biol Med. 2019;133:162-168.
doi pubmed pmc - Wang SJ, Li D, Ou Y, Jiang L, Chen Y, Zhao Y, Gu W. Acetylation is crucial for p53-mediated ferroptosis and tumor suppression. Cell Rep. 2016;17(2):366-373.
doi pubmed pmc - Bykov VJN, Eriksson SE, Bianchi J, Wiman KG. Targeting mutant p53 for efficient cancer therapy. Nat Rev Cancer. 2018;18(2):89-102.
doi pubmed - Wang HH, Ma JN, Zhan XR. Circular RNA Circ_0067934 attenuates ferroptosis of thyroid cancer cells by miR-545-3p/SLC7A11 signaling. Front Endocrinol (Lausanne). 2021;12:670031.
doi pubmed pmc - Ji FH, Fu XH, Li GQ, He Q, Qiu XG. FTO prevents thyroid cancer progression by SLC7A11 m6A methylation in a ferroptosis-dependent manner. Front Endocrinol (Lausanne). 2022;13:857765.
doi pubmed pmc - Wang W, Green M, Choi JE, Gijon M, Kennedy PD, Johnson JK, Liao P, et al. CD8(+) T cells regulate tumour ferroptosis during cancer immunotherapy. Nature. 2019;569(7755):270-274.
doi pubmed pmc - Luo X, Gong HB, Gao HY, Wu YP, Sun WY, Li ZQ, Wang G, et al. Oxygenated phosphatidylethanolamine navigates phagocytosis of ferroptotic cells by interacting with TLR2. Cell Death Differ. 2021;28(6):1971-1989.
doi pubmed pmc - Cai Q, Zhao X, Wang Y, Li S, Wang J, Xin Z, Li F. LINC01614 promotes osteosarcoma progression via miR-520a-3p/SNX3 axis. Cell Signal. 2021;83:109985.
doi pubmed - Liu AN, Qu HJ, Yu CY, Sun P. Knockdown of LINC01614 inhibits lung adenocarcinoma cell progression by up-regulating miR-217 and down-regulating FOXP1. J Cell Mol Med. 2018;22(9):4034-4044.
doi pubmed pmc
This article is distributed under the terms of the Creative Commons Attribution Non-Commercial 4.0 International License, which permits unrestricted non-commercial use, distribution, and reproduction in any medium, provided the original work is properly cited.
World Journal of Oncology is published by Elmer Press Inc.