

| World Journal of Oncology, ISSN 1920-4531 print, 1920-454X online, Open Access |
| Article copyright, the authors; Journal compilation copyright, World J Oncol and Elmer Press Inc |
| Journal website https://www.wjon.org |
Original Article
Volume 13, Number 5, October 2022, pages 299-310

A Novel Cuproptosis-Related Signature Identified DLAT as a Prognostic Biomarker for Hepatocellular Carcinoma Patients
Wen Dong Baia, f, Jun Yu Liub, f, Miao Lic, f, Xi Yangd, Yu Lan Wange, Guang Jun Wangd, g, Shi Chao Lie, g
aDepartment of Hematology, General Hospital of Xinjiang Military Command, Urumqi, Xinjiang, China
bDepartment of Gastroenterology, Third Affiliated Hospital of Sun Yat-Sen University, Guangzhou, 510060, China
cSchool of Rehabilitation Medicine, Xinjiang Medical University, Urumqi, Xinjiang, China
dDepartment of Medical Service, General Hospital of Xinjiang Military Command, Urumqi, Xinjiang, China
eDepatment of Pathology, General Hospital of Xinjiang Military Command, Urumqi, Xinjiang, China
fThese authors contributed equally to this work.
gCorresponding Author: Guang Jun Wang, Department of Medical Service, General Hospital of Xinjiang Military Command, 830000 Urumqi, Xinjiang, China; Shi Chao Li, Department of Pathology, General Hospital of Xinjiang Military Command, 830000 Urumqi, Xinjiang, China
Manuscript submitted September 21, 2022, accepted October 13, 2022, published online October 22, 2022
Short title: Cuproptosis-Related Signature in HCC
doi: https://doi.org/10.14740/wjon1529
| Abstract | ▴Top |
Background: Hepatocellular carcinoma (HCC) is the most common type of liver cancers, with more than a million cases per year by 2025. Cuproptosis is a novel form of programmed cell death, and is caused by mitochondrial lipoylation and destabilization of iron-sulfur proteins triggered by copper, which was considered as a key player in various biological processes. However, the roles of cuproptosis-related genes (CRGs) in HCC remain largely unknown.
Methods: In the present study, we constructed and validated a four CRGs signature for predicting the overall survival (OS) of HCC patients in both The Cancer Genome Atlas (TCGA) and International Cancer Genome Consortium (ICGC) databases.
Results: Patients with high CRGs risk score showed shorter OS than those with low CRGs risk score. Functional analysis suggested that the CRGs-based prognostic signature was associated with metabolism remodeling which facilitated liver cancer progression. In addition, reduced infiltration of CD8+ T cells and increased macrophages were found in HCCs from patients with high CRGs risk score. As one of the four CRGs, higher expression of dihydrolipoamide S-acetyltransferase (DLAT) was accompanied by higher expression of program death ligand 1 (PD-L1) in HCC. Further, we confirmed that DLAT was up-regulated and correlated with poor prognosis in a clinical HCC cohort.
Conclusion: In conclusion, our study constructed a four CRGs signature prognostic model and identified DLAT as an independent prognostic factor for HCC, thus providing new clues for understanding the association between cuproptosis and HCC.
Keywords: Cuproptosis; DLAT; Hepatocellular carcinoma; Biomarker
| Introduction | ▴Top |
Liver cancer ranks as the sixth leading cause of cancer-related death, with hepatocellular carcinoma (HCC) leading the way [1]. There will be more than a million cases of HCC worldwide by 2025, representing an annual increase of more than 10% [1-3]. Globally, the long-term overall survival (OS) of HCC patients was still dismal, with an average 5-year survival rate below 12% [3]. The etiology of HCC is highly heterogeneous, which includes hepatitis B virus/hepatitis C virus (HBV/HCV) infection, alcoholic liver disease, and non-alcoholic fatty liver disease (NAFLD) [1, 4]. Due to the aggressive growth pattern and latent symptoms, most HCC patients are diagnosed at an advanced stage of the disease. Those patients are often not eligible for surgical treatments, resulting in minimal availability and effectiveness of therapeutic options [1, 5]. In addition, a considerable portion of HCC patients do not response to the existed therapies, such as multi-kinase targeted inhibitors, immune checkpoint inhibitors and immunocombination therapy [6, 7]. Thus, effective personalized therapeutic targets and guiding biomarkers for HCC are urgently needed.
Copper is a mineral nutrient that is closely associated with cancer cell proliferation and death [8]. It has been posited that copper deficiency contributes to a variety of diseases, including cancer [8], neurological [9], cardiovascular [10], and metabolic illnesses [11]. Copper accumulation also contributes to cell death. In a recent study, Tsvetkov et al reported that abnormal copper accumulation could trigger mitochondrial lipoylation and destabilization of iron-sulfur proteins, induce oxidative stress, cytotoxicity and cell death, making it different from other types of cell death, such as necrosis, autophagy, and apoptosis. Hence, they proposed the name “cuproptosis” [12]. So far, 10 genes (ferredoxin 1 (FDX1), lipoic acid synthetase (LIAS), lipoyltransferase 1 (LIPT1), dihydrolipoamide dehydrogenase (DLD), dihydrolipoamide S-acetyltransferase (DLAT), pyruvate dehydrogenase E1 subunit alpha 1 (PDHA1), pyruvate dehydrogenase E1 subunit beta (PDHB), metal regulatory transcription factor 1 (MTF1), glutaminase (GLS), and cyclin-dependent kinase inhibitor 2A (CDKN2A)) are found to be related to cuproptosis [12], which was defined as cuproptosis-related genes (CRGs) in the current study. In melanoma [13] and clear cell renal cell carcinoma [14], cuproptosis-related signatures are considered to be valuable for predicting patients’ prognosis and immune infiltration. Despite this, cuproptosis’ role is largely unknown in HCC.
In the present study, we focused on the potential roles of cuproptosis in HCC. Firstly, we constructed a four CRGs signature prognostic model for HCC using the data from the Cancer Genome Atlas (TCGA) database, and data from the International Cancer Genome Consortium (ICGC) were used to validate the model. Then we conducted gene ontology (GO), Kyoto Encyclopedia of Genes and Genomes (KEGG) and gene set enrichment analysis (GSEA) in both databases based on the four CRGs’ risk scores. Moreover, the correlation of DLAT and program death ligand 1 (PD-L1) was also detected. Finally, we assessed the expression of DLAT and its prognostic value in a clinical cohort of HCC patients.
| Materials and Methods | ▴Top |
Patients and HCC samples
A total of 120 HCC and paired paratumor tissues were collected from patients undergoing surgical resection at the General Hospital of the Xinjiang Military Command from 2010 to 2015. The specimen collection procedure was approved by the Ethics Committee of the General Hospital of Xinjiang Military Command, and the detailed information is contained in Supplementary Table 1 (www.wjon.org). OS and recurrence-free survival (RFS) were analyzed using the Kaplan-Meier method. At the last follow-up visit, OS was determined by dividing the date of surgery by the date of death or censoring, while RFS was determined by dividing the date of surgery by the date of recurrence or censoring. Thirty-six paired samples of paired HCC and paratumor tissues from HCC patients were used for real-time PCR analysis of DLAT mRNA.
RNA extract and real-time PCR
Reverse transcription was performed using a reverse transcription system (Promega) to synthesize cDNA from total RNA isolated from tissues using Trizol (Invitrogen). Light Cycler 96 System (Roche, USA) and SYBR Green PCR Kit (Roche) were used to perform real-time PCR on generated cDNA samples (1 µg). Relative mRNA expression levels were calculated using the 2-ΔΔCt method, and relative expression was normalized to β-actin. DLAT: forward primer: 5’-CCGCCGCTATTACAGTCTTCC-3’, reverse primer: 5’-CTCTGCAATTAGGTCACCTTCAT-3’. β-actin: forward primer: 5′-GACGATATCGCTGCGCTGG-3′, reverse primer: 5′-CCACGATGGAGGGGAATA-3′.
Immunohistochemistry
Formalin-fixed paraffin-embedded (PPFE) human tissue microarray was deparaffinized and rehydrated, and antigens were then retrieved by heat with EDTA buffer. After blocking endogenous peroxidase with 3% hydrogen peroxide for 20 min, goat serum was added for 30 min. Subsequently, primary antibodies (DLAT: abclonal, A14530; PD-L1: VENTANA, SP263) were incubated overnight at 4 °C and revealed by secondary antibody (goat anti-rabbit). Finally, DAB (K3486, DAKO) was applied for color development, followed by hematoxylin counterstaining. ScanScopeXT (Aperio Technologies, Vista, CA) was used to scan immunostained sections, and Positive Pixel Count (Image Scope) was used to calculate the positive pixel count.
Data collection
The level 3 RNA sequencing (RNA-seq) data and corresponding clinical information of 371 cases of HCC and 50 cases of normal tissues were downloaded from the TCGA website (https://portal.gdc.cancer.gov/). Validation data of 260 HCC patients were obtained from the ICGC portal (https://dcc.icgc.org/projects/LIRI-JP), which include tumor and normal tissues of major patients. Two hundred thirty-two cases of HCC with complete survival data were used for further analysis. Ten CRGs: FDX1, LIAS, LIPT1, DLD, DLAT, PDHA1, PDHB, MTF1, GLS and CDKN2A, were obtained from published literature, which were confirmed to be associated with cuproptosis by CRISPR-Cas9 [12].
Construction and validation of a cuproptosis-related prognostic signature
To explore CRGs that are essential for OS of HCC, univariate analysis was performed to assess the prognostic value of the 10 CRGs in the TCGA cohort. Utilizing the “glmnet” R package, a prognostic model for cuproptosis was constructed using LASSO-penalized Cox regression. The minimum λ was determined through 10-fold cross-validation. The risk scores of the patients were calculated as follow: risk score = sum (each gene’s expression × corresponding coefficient), according to the normalized expression of each gene and its coefficient. As described above, the regression coefficients from the TCGA cohort were applied to the ICGC validation set to calculate the risk score.
Survival analysis and receiver operating characteristic (ROC) analysis of the prognostic model
As determined by the median value of the risk score, patients were grouped into high- and low-risk groups. Based on Kaplan-Meier analysis, the log-rank test was used to determine whether there was a significant difference in OS time between high-risk and low-risk groups. In addition, ROC curve analysis was conducted to evaluate the predictive power of the prognostic signature over time. Lastly, univariate and multivariate Cox regression analyses were performed to measure whether the CRGs-based signature was an independent prognostic indicator for OS.
Differentially expressed genes (DEGs) analysis
In both the TCGA and ICGC cohorts, “limma” R packages were used to explore DEGs between high- and low-risk score groups. Genes with |log2FC| > 1.5, P. adj < 0.05 were selected as DEGs and visualized by volcano plot.
Functional enrichment analysis
In order to identify the functions of DEGs, analysis of GO and KEGG pathway enrichment was performed using the “clusterProfiler” R package, and P values were determined by Fisher’s exact test, which was corrected by multiple testing using Benjamini-Hochberg (BH) method. Then, “ggplot2” R package was employed to visualized GO and KEGG results.
Immune infiltration and correlation analysis
“CIBERSORT” R package was utilized to investigate immune infiltrates in each sample. A Wilcoxon test was used to compare different groups’ immune infiltrate compositions and Spearman correlation analysis was used to analyze the relationship between the expression of CRGs and immune target genes. Single sample gene set enrichment analysis (ssGSEA) was performed to evaluate the correlation of immune cells in high and low LIPT1, high and low DLAT, high and low CDKN2A, high and low GLS groups according to the medium value of mRNA expression.
Statistical analysis
Univariate Cox regression and LASSO-penalized Cox regression were applied to construct prognostic signature model. Log-rank tests were performed to determine the significance of OS, disease-free survival (DFS), and RFS differences by using Kaplan-Meier analysis. ROC curve analysis was conducted to evaluate the predictive power of the prognostic signature over time. Wilcox test or unpaired t-test was used to compare statistical differences between two groups. Spearman correlation analysis was conducted to assess the correlation between expression levels of CRGs and checkpoint-related genes. Chi-test was utilized to investigate the correlation of DLAT and PD-L1 immunohistochemistry (IHC) expression. Univariate and multivariate Cox regression analyses were performed to identify the prognostic value of DLAT. P-value < 0.05 was considered statistically significant.
| Results | ▴Top |
Construction of a cuproptosis-related prognostic model in the TCGA cohort
The prognostic value of 10 CRGs: FDX1, LIAS, LIPT1, DLD, DLAT, PDHA1, PDHB, MTF1, GLS and CDKN2A, was analyzed using univariate Cox regression in the TCGA cohort and five of them were associated with the prognosis of HCC patients, independently (Fig. 1a). A LASSO-Cox regression analysis was then used to identify the strongest prognostic genes among five candidate CRGs. As shown in Figure 1b, c, based on optimal values of lim λ, four of the five candidate CRGs were selected for the model construction. According to the expression and regression coefficient, each patient’s risk score was calculated (risk score = 0.520 × LIPT1 + 0.354 × DLAT + 0.084 × GLS + 0.196 × CDKN2A). Additionally, we analyzed the expression and prognostic value of the four CRGs, and all of them were up-regulated in HCC tissues in comparison with normal tissues (Supplementary Figure 1A, www.wjon.org) and high levels of the 4 CRGs were correlated with unfavorable prognosis of OS, independently (Supplementary Figure 1B-E, www.wjon.org).
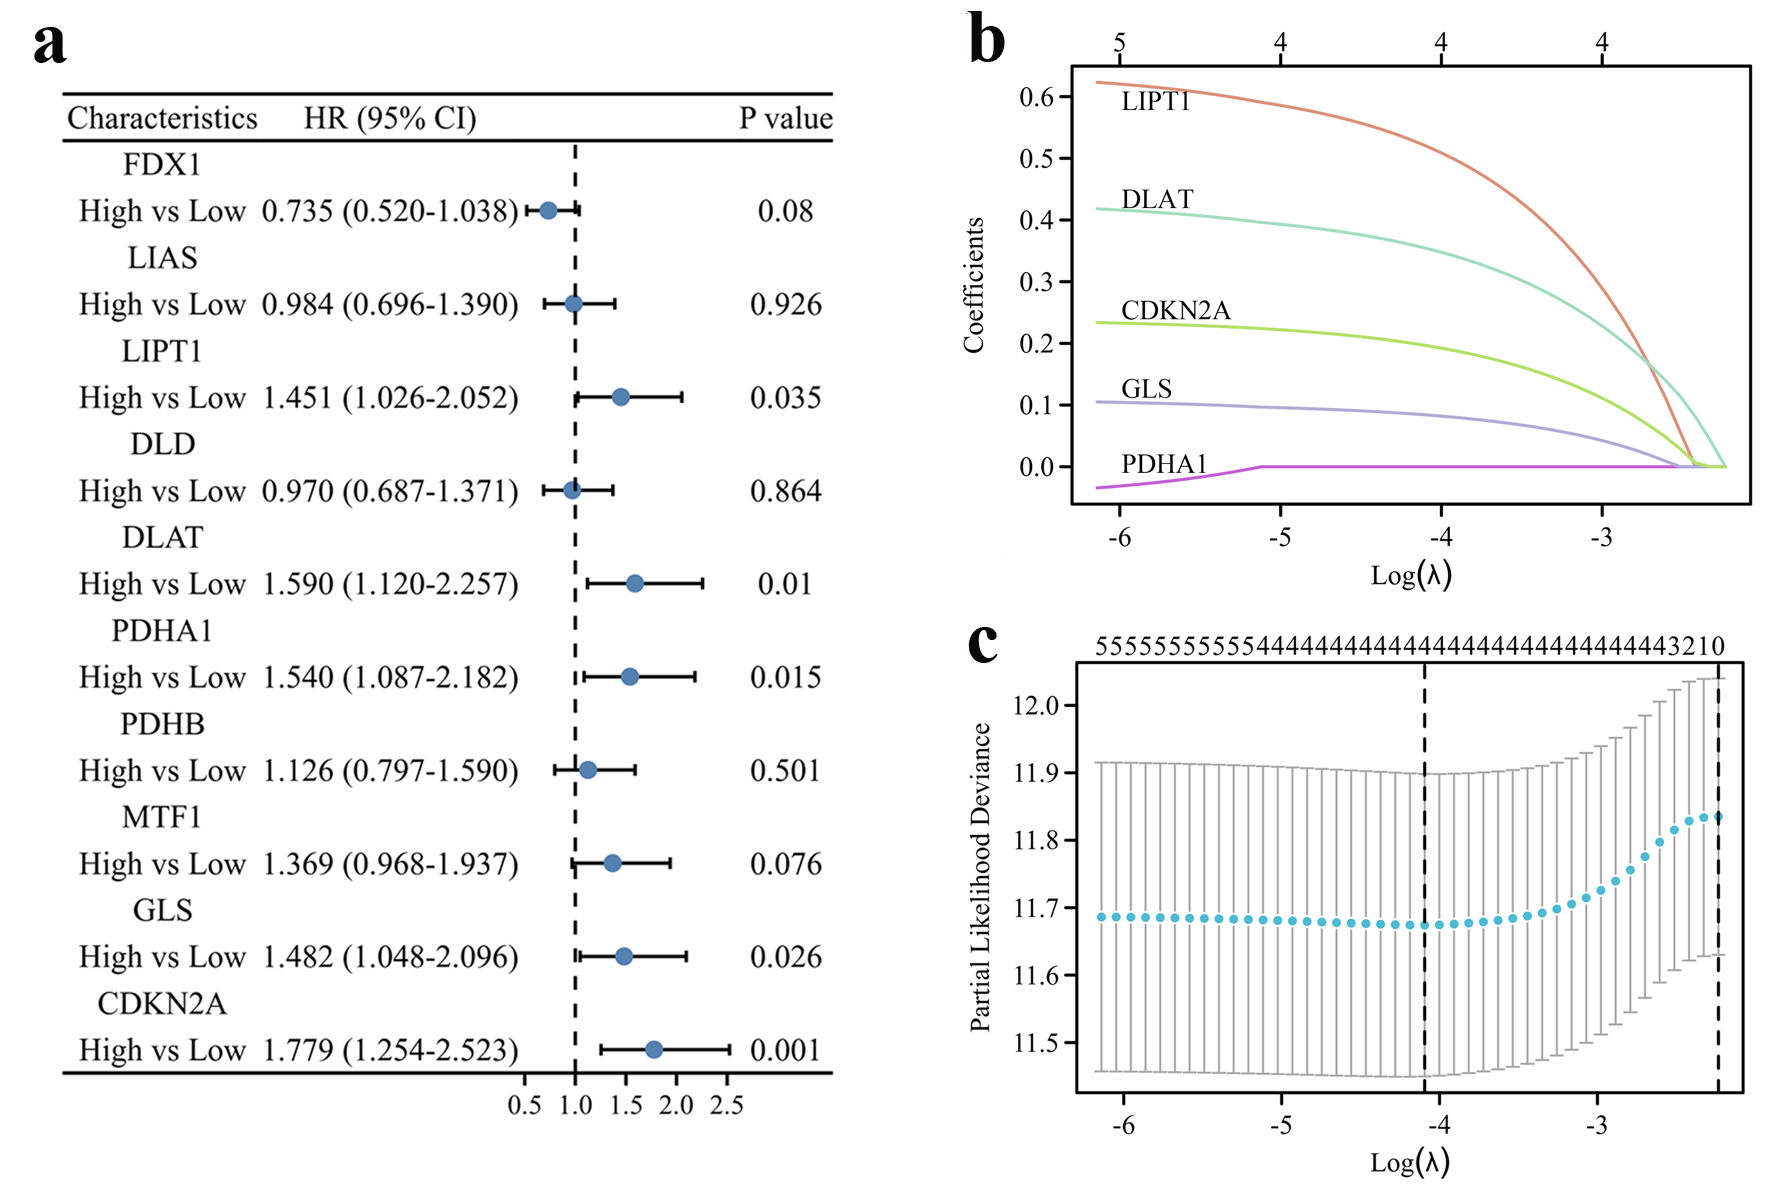 Click for large image | Figure 1. Construction of the cuproptosis-related prognostic signature in the TCGA cohort. (a) The forest plot of univariate Cox regression between OS and 10 CRGs of HCC patients in the TCGA cohort. (b) LASSO coefficient profiles of the CRGs in the TCGA cohort. (c) Cross-validation for λ parameter selection in the LASSO model. |
Thus, patients were stratified into high and low groups according to the four CRGs risk score (Fig. 2a), and an analysis of PCA revealed a two-way distribution of patients in different risk groups (Fig. 2b). Kaplan-Meier curve indicated that patients with high-risk score had a significantly worse OS than those with low-risk score (Fig. 2c). In the time-dependent ROC curve analysis for OS, the area under the curve (AUC) was 0.733 at 1 year, 0.650 at 3 years, and 0.626 at 5 years (Fig. 2d). Additionally, univariate and multivariate Cox regression analysis confirmed that risk score was an independent contributor for OS (Fig. 2e, f).
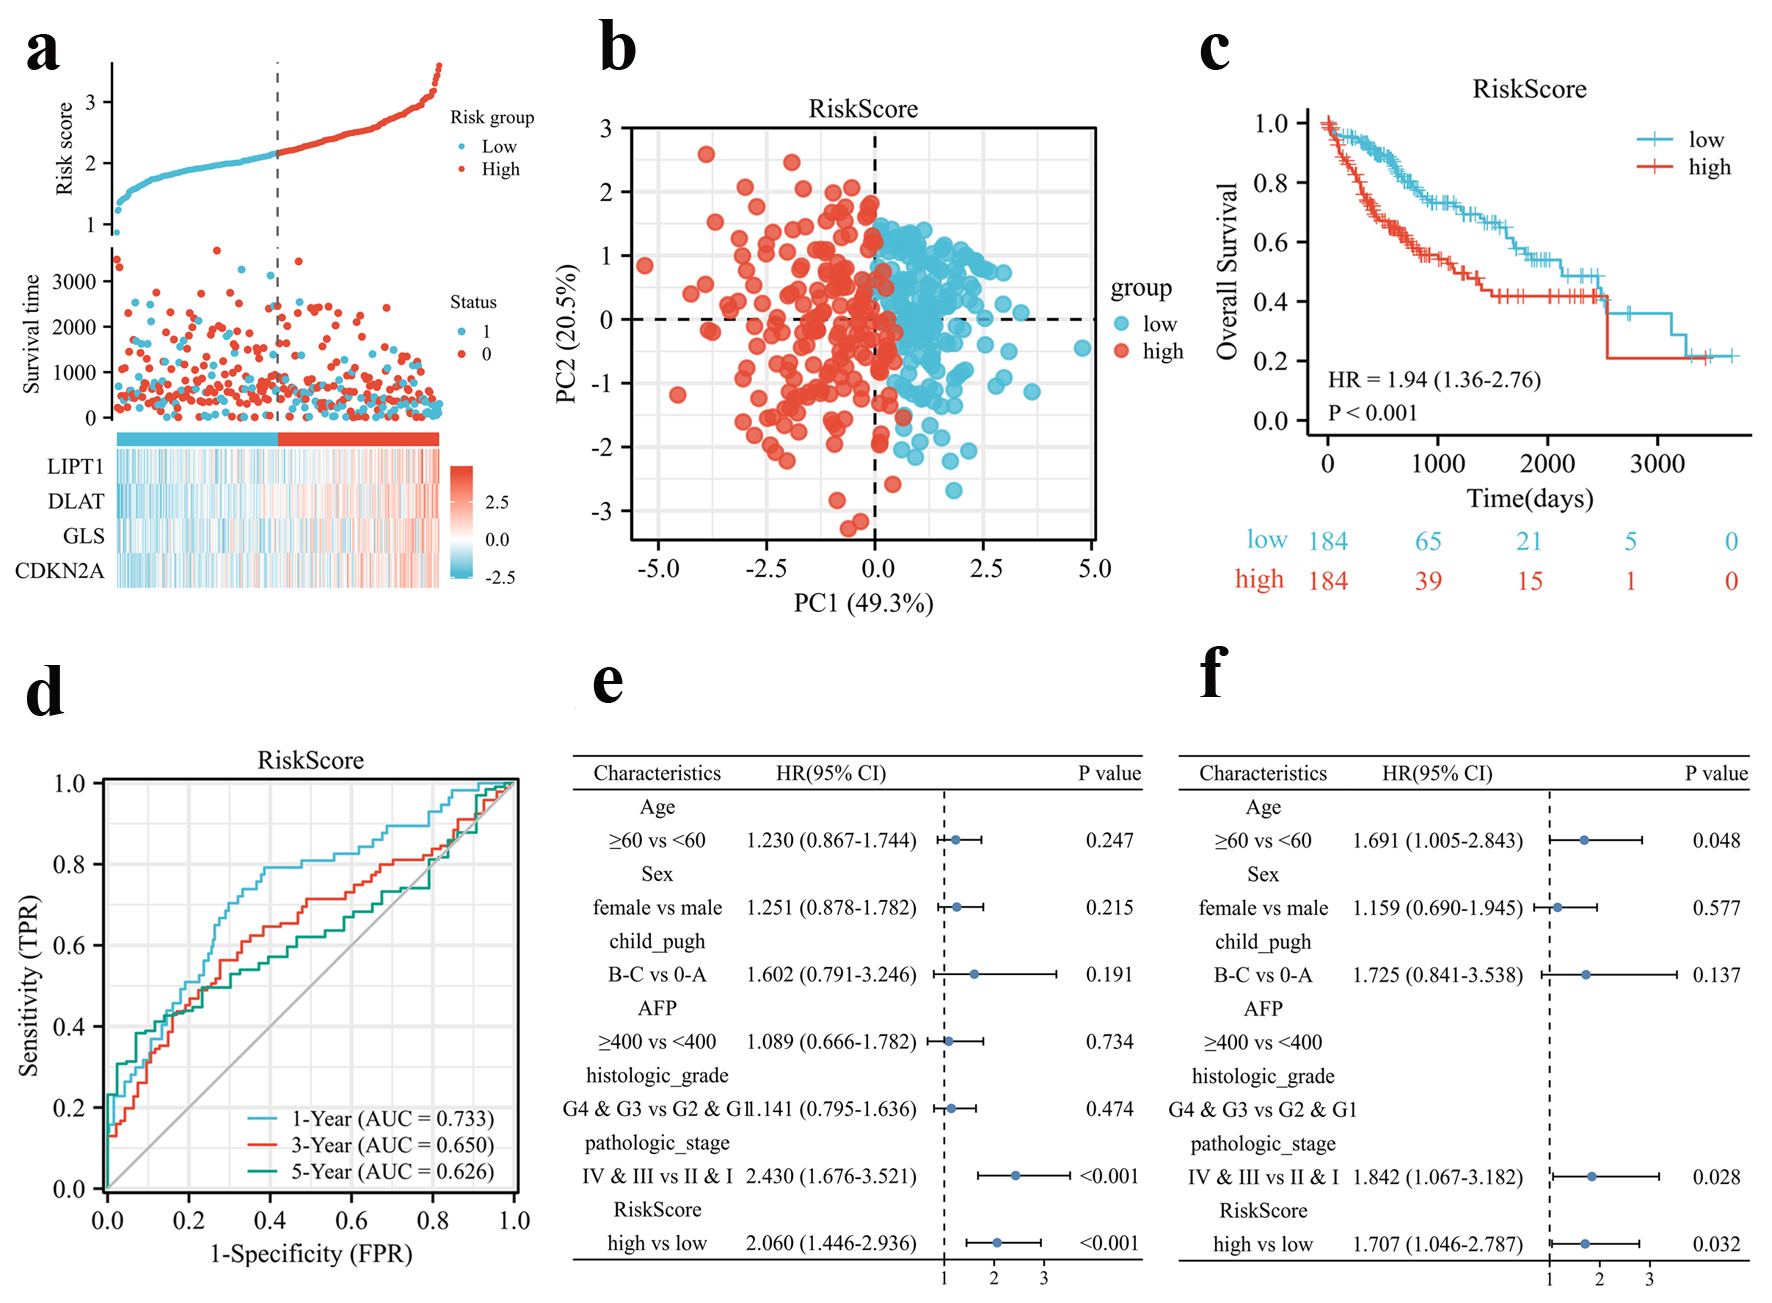 Click for large image | Figure 2. Prognosis analysis of the CRGs signature in the TCGA cohort. (a) Risk scores based on CRGs prognostic signatures (above), survival of HCC patients with high- or low-risk scores (middle), and expression of four CRGs that constitute the prognostic signature in the TCGA cohort (below). (b) PCA analysis of high- and low-risk scores in the TCGA cohort. (c) Kaplan-Meier plot of OS between high- and low-risk score groups in the TCGA cohort. (d) Time-dependent ROC curves for the prognostic performance of the CRGs signature in the TCGA cohort. (e, f) Univariate (e) and multivariate (f) Cox regression analyses regarding OS evaluated the prognostic value of the CRGs signature and other factors in the TCGA cohort. HR: hazard ratio. |
Validation of the four CRGs prognostic signature in the ICGC cohort
To validate the established prognostic signature, HCC patients from the ICGC database (LIRI-JP) were classified into high- and low-risk score groups (Fig. 3a) by the median risk score according to the same formula constructed from the TCGA cohort. Likewise, survival status, risk scores, and expression heatmaps were presented for four CRGs in the validation set (Fig. 3a). Similarly, principal component analysis (PCA) analysis showed that the distribution of patients in different risk groups were two-fold (Fig. 3b). Likewise, the high-risk group of patients died earlier and had a worse OS rate (P = 0.022, hazard ratio (HR) (95% confidence interval (CI)) = 2.02 (1.11 - 3.67)) compared to patients with low-risk score (Fig. 3c). ROC curve for predicting OS based on risk score shows an area under the curve (AUC) of 0.659 at 1 year, and 0.692 at 3 years (Fig. 3d). Furthermore, Cox regression analysis indicated that risk score could be an independent risk factor for OS as well as univariate and multivariate analysis (Fig. 3e, f). Moreover, HCC tissues expressed higher levels of all four CRGs (Supplementary Figure 2A, www.wjon.org) and those with higher CDKN2A or DLAT levels had a poorer OS in the ICGC cohort (Supplementary Figure 2B-E, www.wjon.org).
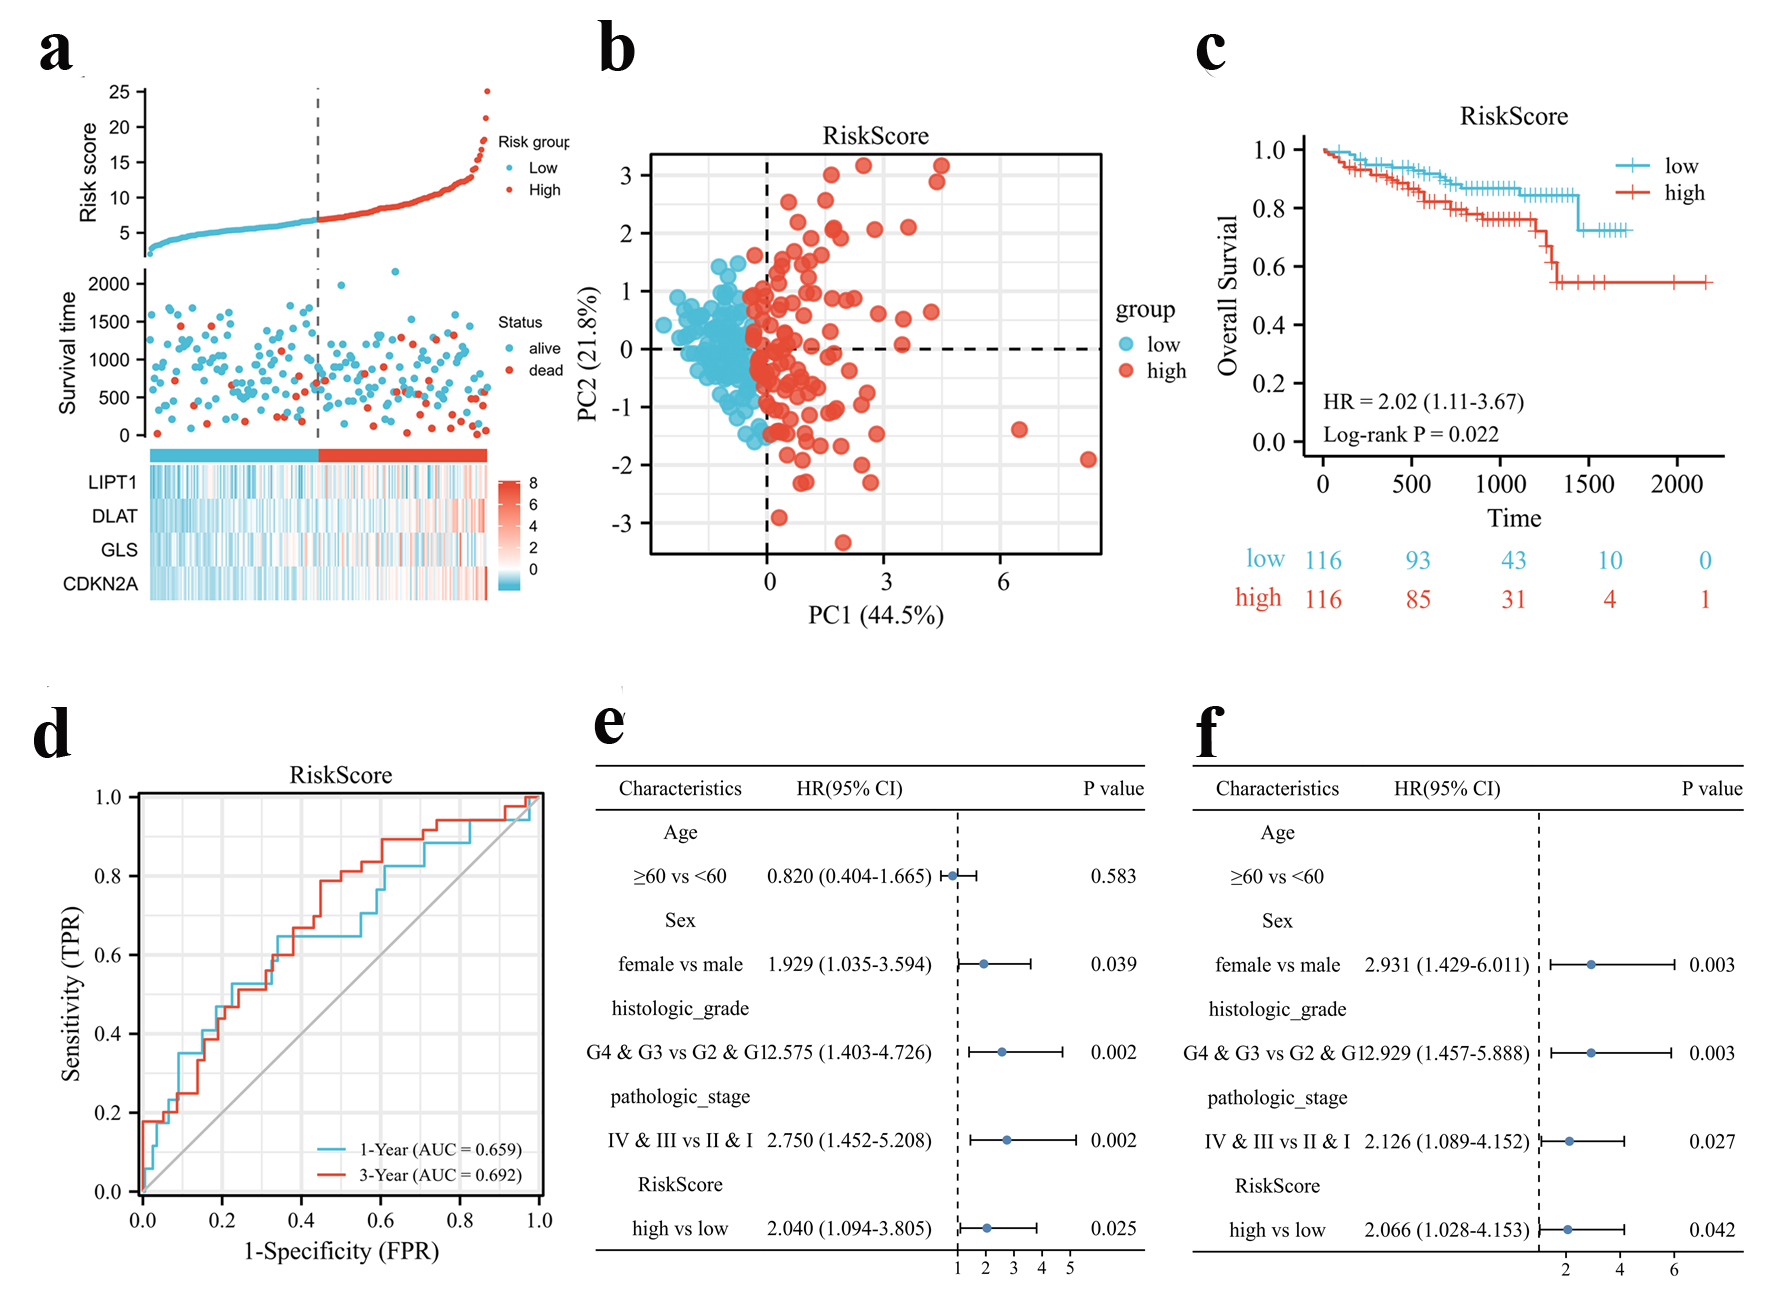 Click for large image | Figure 3. Validation of the CRGs signature in the ICGC cohort. (a) Risk scores based on CRGs prognostic signatures (above), survival of HCC patients with high- or low-risk scores (middle), and expression of four CRGs that constitute the prognostic signature in the ICGC cohort (below). (b) PCA analysis of high- and low-risk scores in the ICGC cohort. (c) Kaplan-Meier plot of OS between high- and low-risk score groups in the ICGC cohort. (d) Time-dependent ROC curves for the prognostic performance of the CRGs signature in the ICGC cohort. (e, f) Univariate (e) and multivariate (f) Cox regression analyses regarding OS evaluated the prognostic value of the CRGs signature and other factors in the ICGC cohort. HR: hazard ratio. |
Identification of CRGs-associated biological pathways
To further explore the underlying biological features implicated with CRGs-based prognostic signature, GO, KEGG and GSEA functional enrichment analysis were conducted based on DEGs identified between high- and low-risk groups in both the TCGA and ICGC cohorts. As shown in Figure 4a, e, a total of 331 genes were up-regulated and 453 genes were down-regulated in the group with high-risk score compared to the group with low-risk score in the TCGA cohort, while 203 genes were up-regulated and 76 genes were down-regulated in the ICGC cohort (|log2 FC| > 1.5, adj. P < 0.05). There were several significant enrichments of metabolic GO terms in the TCGA cohort, including monocarboxylic acid metabolic processes, steroid metabolic process, organic acid biosynthetic process, carboxylic acid biosynthetic process and steroid catabolic process, which were associated with tricarboxylic acid (TCA) cycle in cell metabolism (Supplementary Figure 3A, www.wjon.org). In line with expectations, those DEGs were involved in pathways well characterized as HCC drivers, including xenobiotic metabolism by cytochrome P450, chemical carcinogenesis, retinol metabolism, etc. (Fig. 4b). GSEA demonstrated that the biological processes of cell cycle, extracellular matrix (ECM)-receptor interaction, leishmaniasis, microRNAs in cancer and rheumatoid arthritis were significantly enriched (Fig. 4c), while chemical carcinogenesis-DNA adducts, complement and coagulation cascades, drug metabolism-cytochrome P450, glycine, serine and threonine metabolism and metabolism of xenobiotics by cytochrome P450 were down-regulated in high-risk score group (Fig. 4d). Likewise, in the ICGC cohort, neuroactive ligand-receptor interaction, tyrosine metabolism, microRNAs in cancer were significantly enriched in GO and KEGG terms (Fig. 4f, Supplementary Figure 3B, www.wjon.org). GESA results showed a same trend in cell cycle, chemical carcinogenesis-DNA adducts, complement and coagulation cascades, glycine, serine and threonine metabolism and metabolism of xenobiotics by cytochrome P450 in the ICGC cohort (Fig. 4g, h).
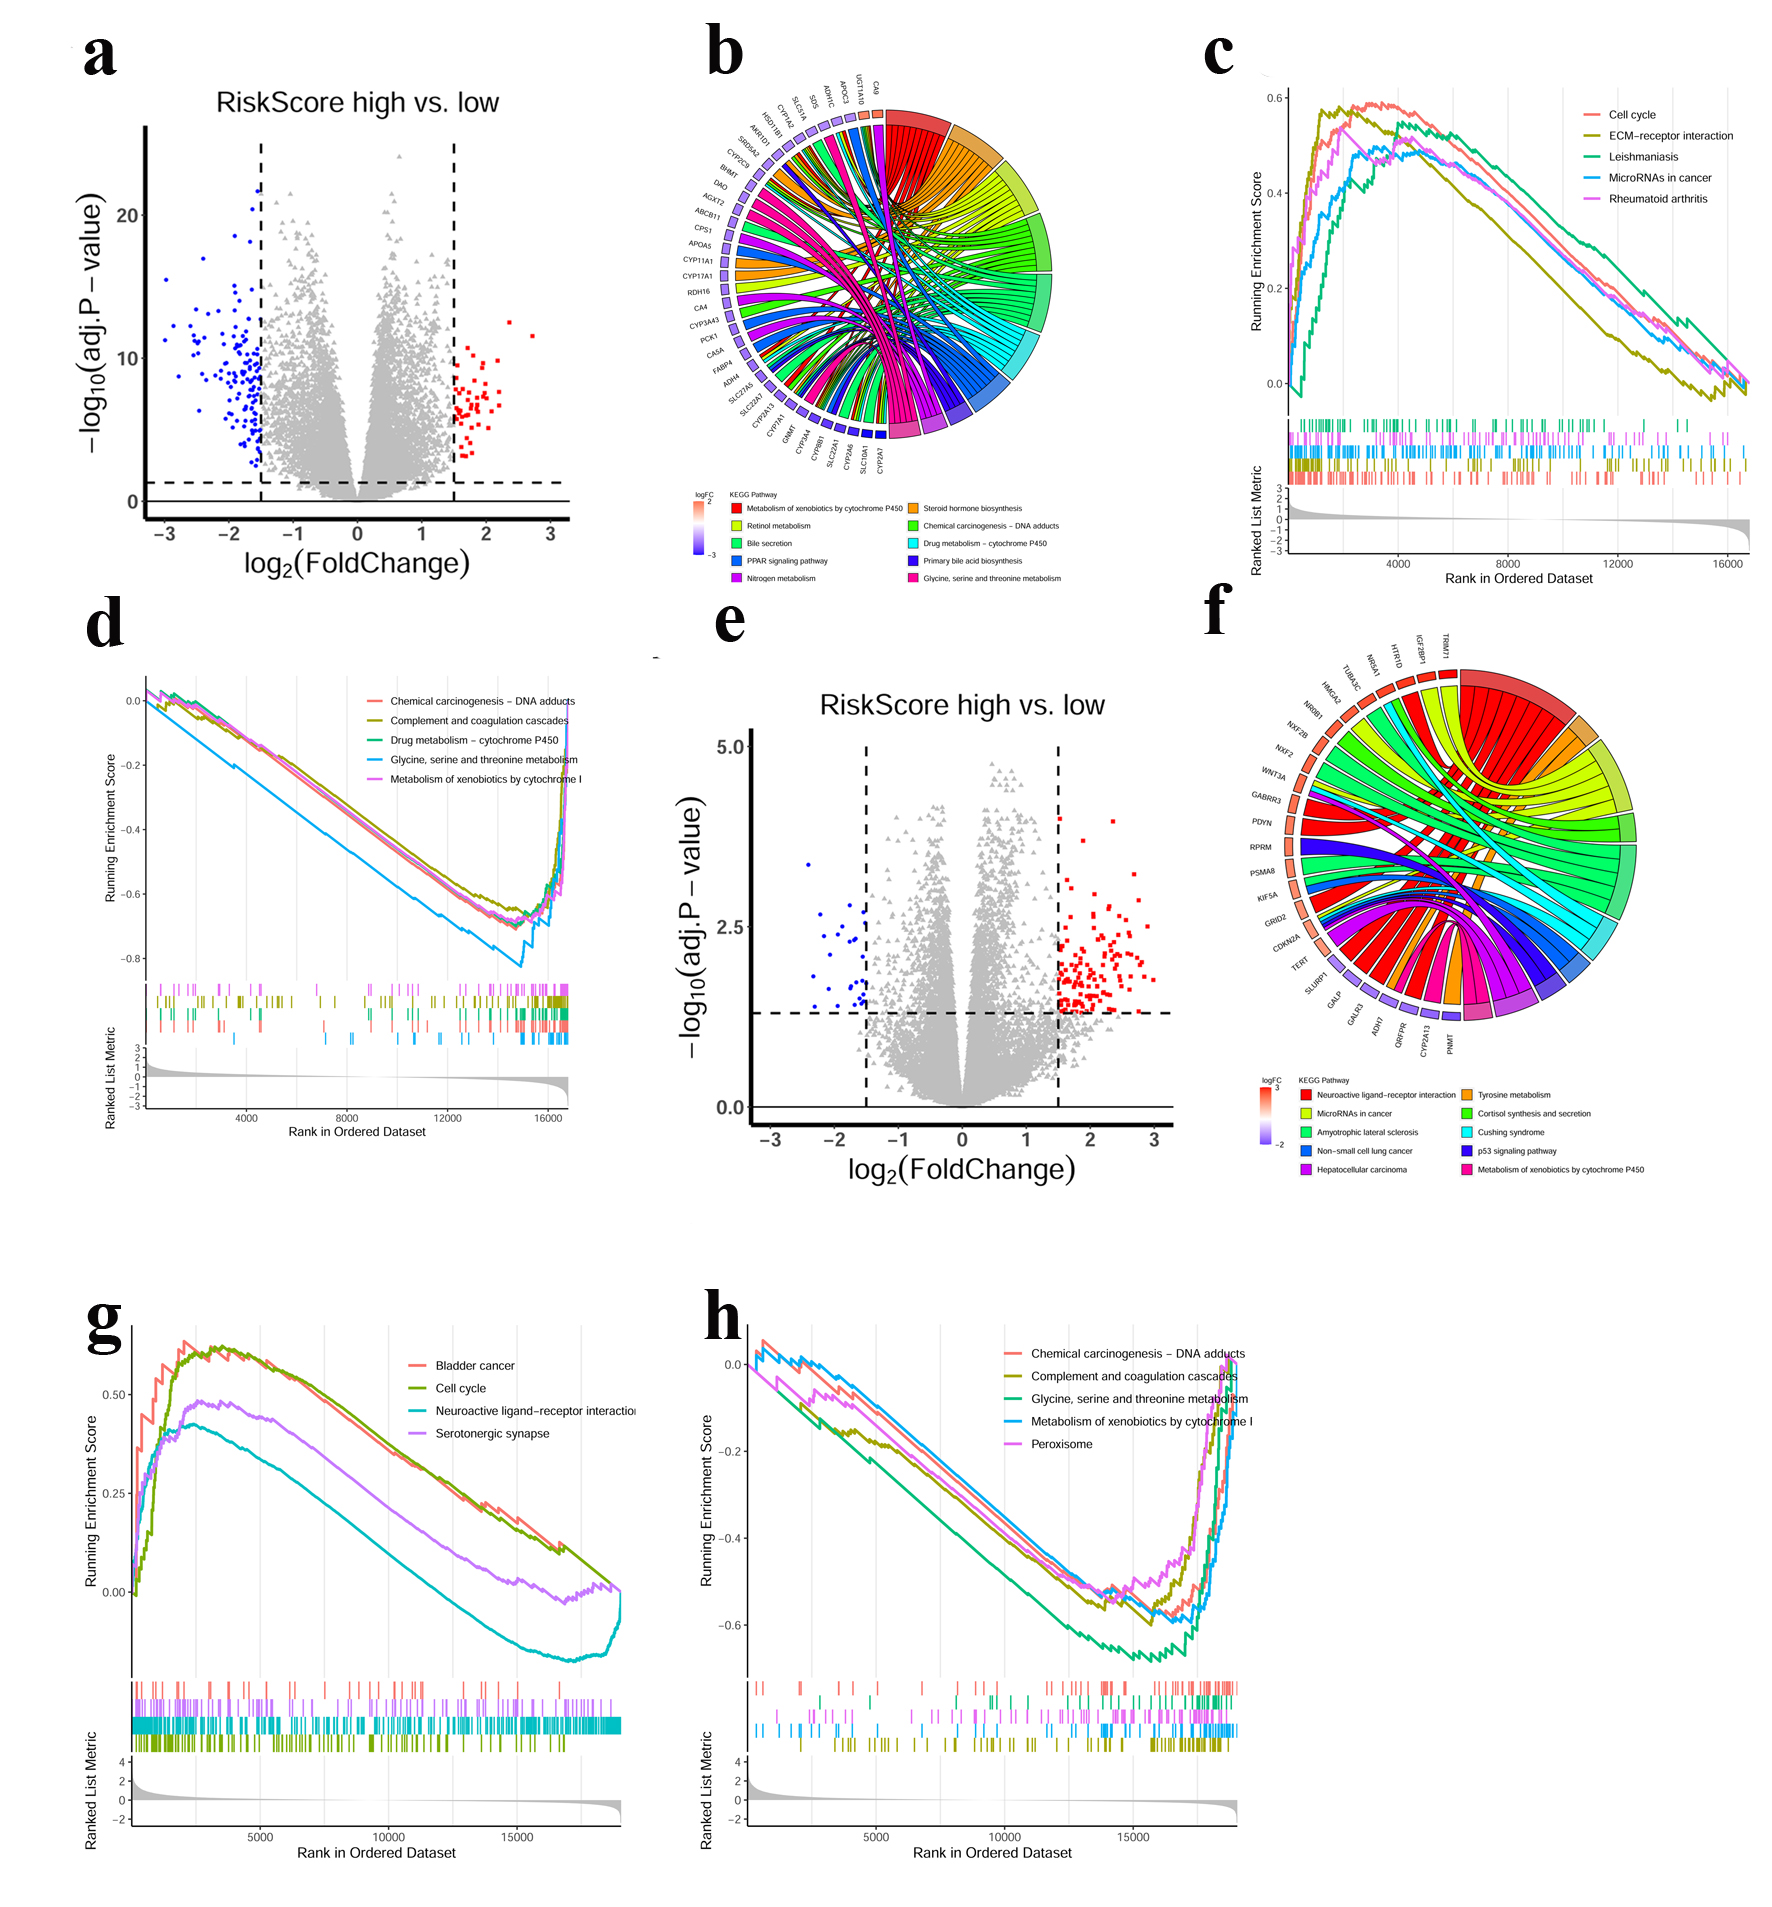 Click for large image | Figure 4. Functional annotations of the CRGs prognostic signature. (a) DEGs volcano plots between high- and low-risk score groups in the TCGA cohort. Each red dot indicates an up-regulated gene, and each blue dot indicates a down-regulated gene (Fold change > 1.5, adj. P < 0.05). (b) Circle plot showed the enriched KEGG pathways of DEGs between high- and low-risk score groups in the TCGA cohort. (c, d) GSEA analysis of DEGs in the TCGA cohort. Hallmarks that significantly enriched in the high (c) and low (d) risk score groups were shown. (e) DEGs volcano plots between high- and low-risk score groups in the ICGC cohort. Each red dot indicates an up-regulated gene, and each blue dot indicates a down-regulated gene (Fold change > 1.5, adj. P < 0.05). (f) Circle plot showed the enriched KEGG pathways for the DEGs between high- and low-risk score groups in the ICGC cohort. (g, h) GSEA analysis of DEGs in the ICGC cohort. Hallmarks that significantly enriched in the high (g) and low (h) risk score groups were shown. |
Relevance between the four CRGs signature and immune microenvironment
By using the “CIBERSORT” R package, we constructed 22 immune infiltrate profiles in HCC to test the relationship between our signature and immune microenvironment. The results revealed that increased M0 macrophage and decreased CD8+ T cells infiltration were associated with high-risk scores (Fig. 5a, Supplementary Figure 4A, B, www.wjon.org). Further ssGSEA analysis revealed that DLAT, CDKN2A, LIPT1 and GLS were positively correlated with several CD4+ T cell subsets, such as T helper cells, Th2 cells, and were negatively correlated with CD8+ cytotoxic cells, DC and pDC in the high-risk group (Fig. 5b-e). Based on the above results, HCC patients with high-risk scores may display an immune suppressive microenvironment. Furthermore, we found that the four CRGs were correlated with the expression of most immune checkpoint-related genes (Fig. 5f). Interestingly, DLAT had the strongest positive correlation with CD274 (PD-L1), while GLS had positive correlation with VISTA and TIM3 in the TCGA cohort (Fig. 5f). To further confirm the correlation, we assessed the expression of DLAT and PD-L1 in HCC tissues. The results of IHC staining showed that patients with higher expression of DLAT in HCC were accompanied by higher expression of PD-L1 (Fig. 5g, h, Supplementary Figure 4C, www.wjon.org).
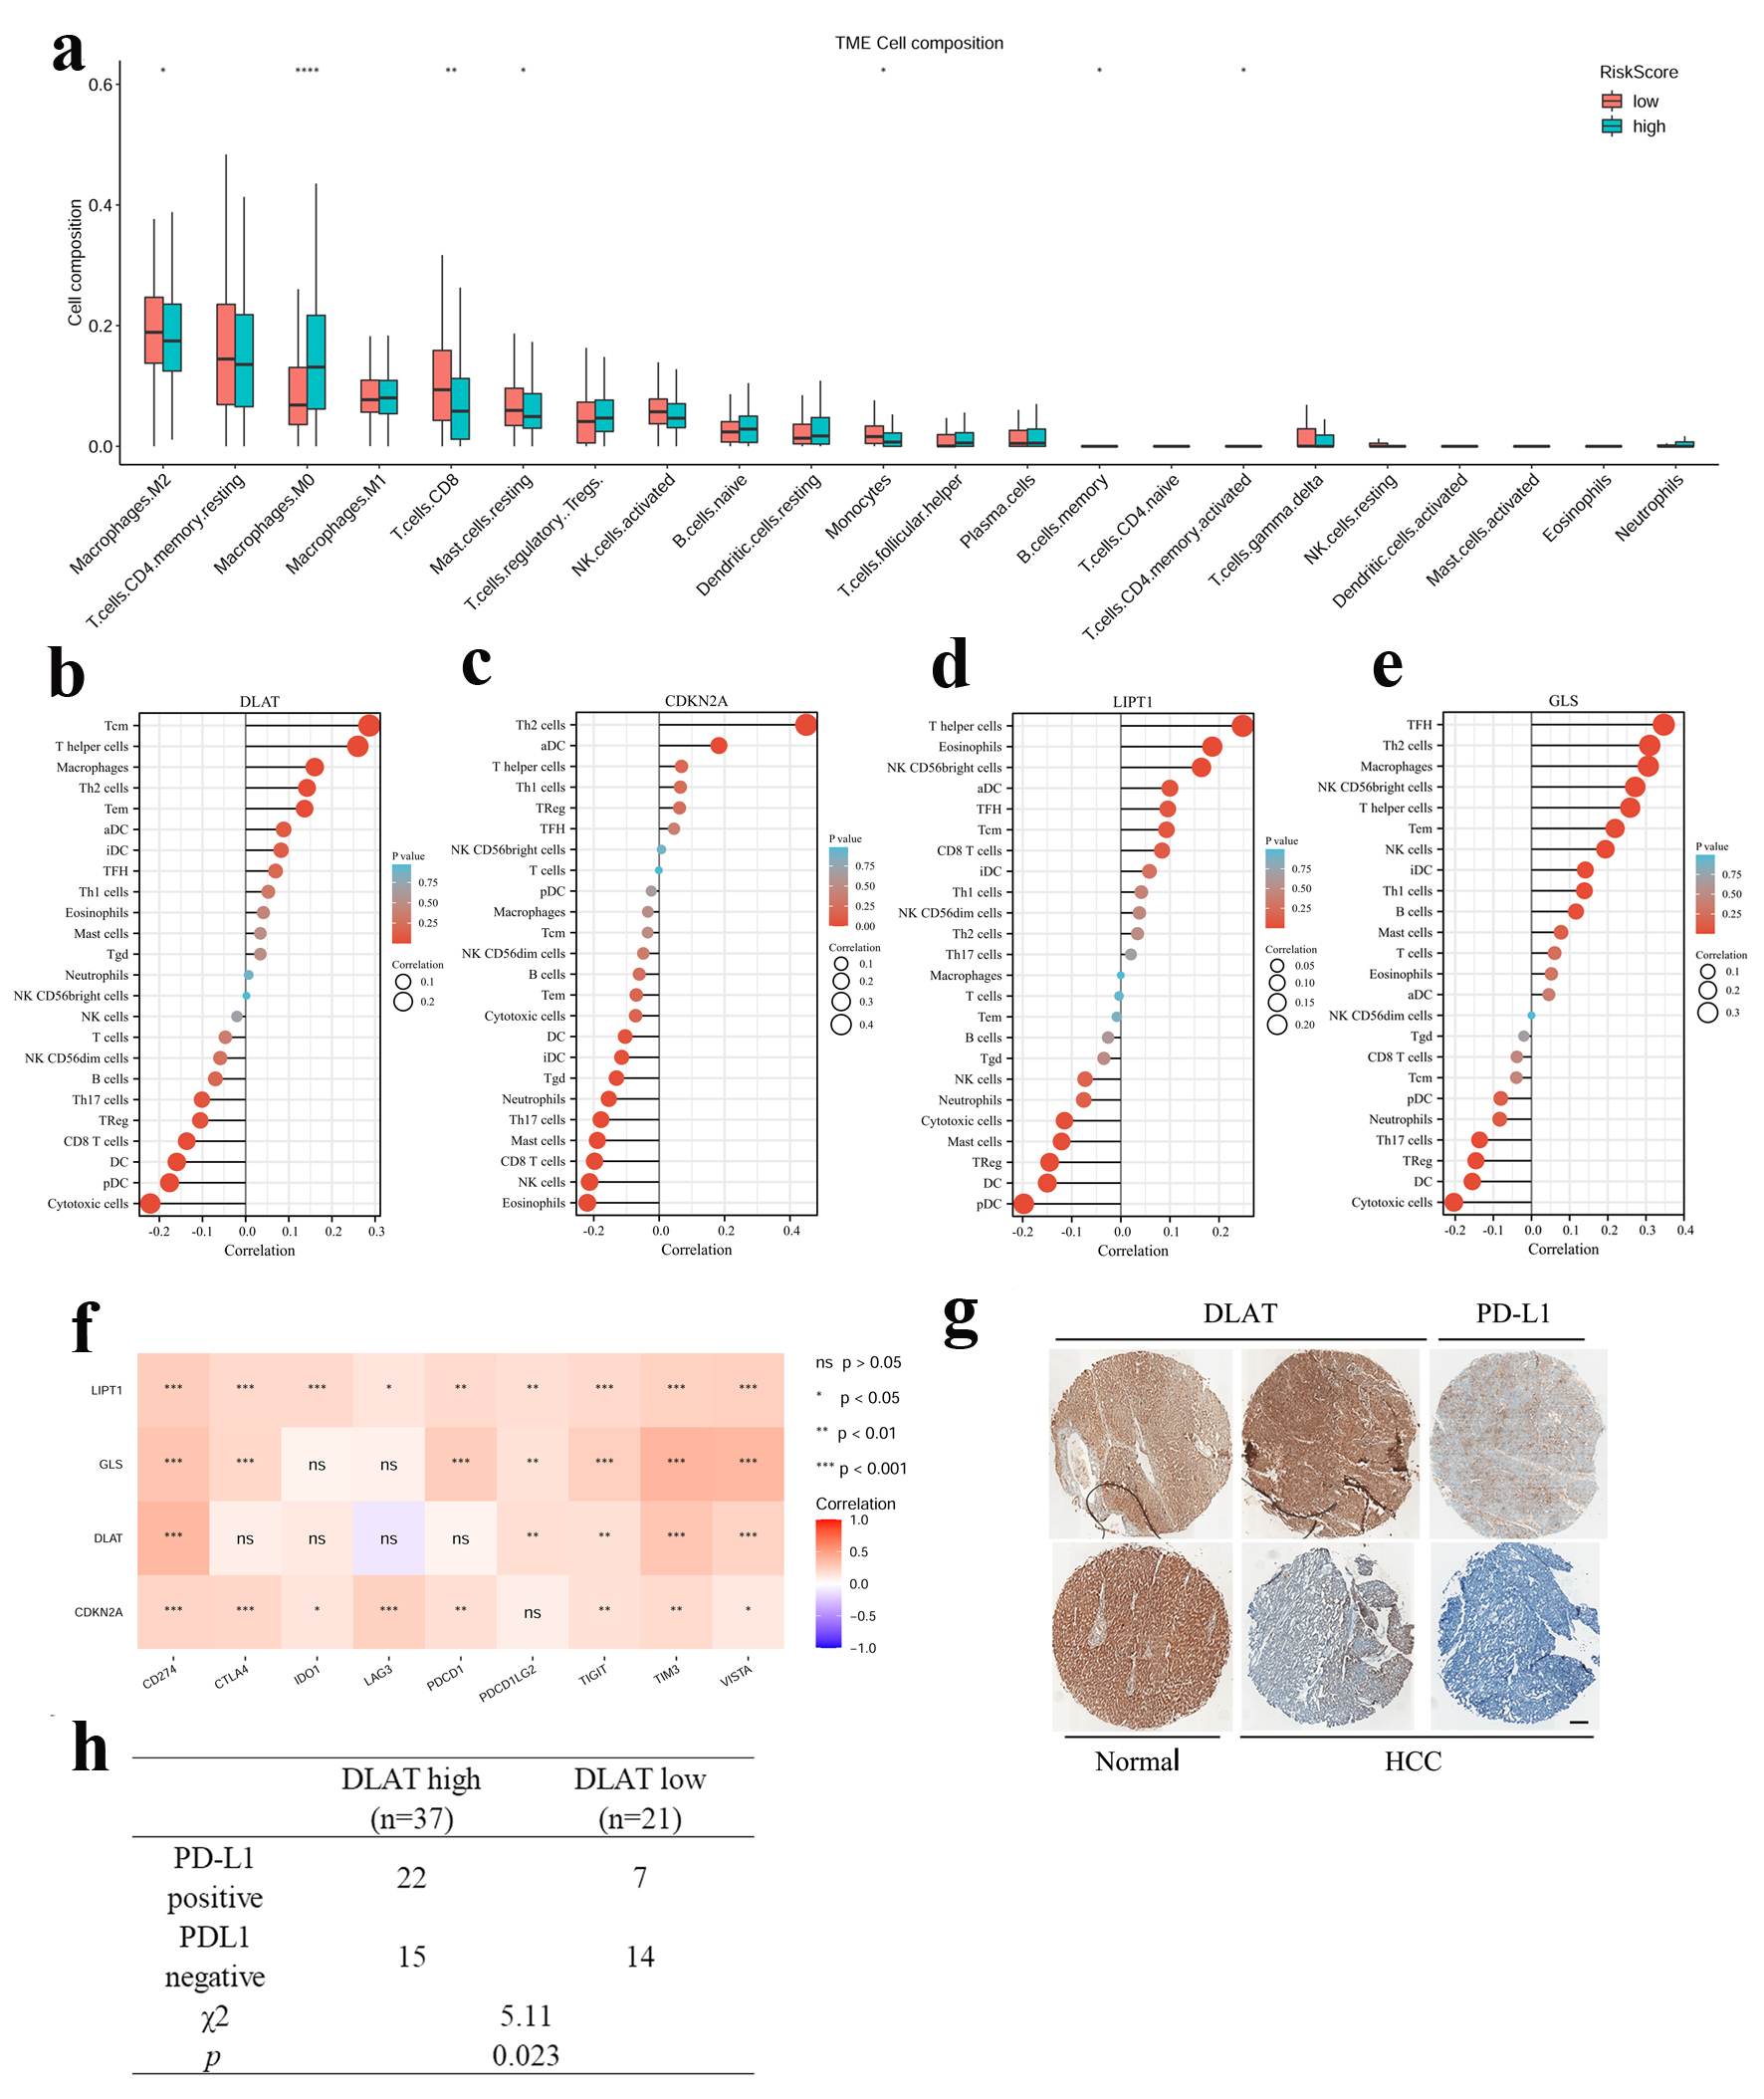 Click for large image | Figure 5. Relevance between four CRGs signature and the immune microenvironment. (a) Compare of 22 immune infiltrates between high -and low-risk score HCC samples. Wilcoxon rank sum test was used for the significance test (*P < 0.05, **P < 0.01, ***P < 0.001). (b-e) Lollipop chart showed the correlation of four CRGs with tumor infiltration cells (TICs) proportion in HCC. (f) The correlation between four CRGs and immune checkpoint related genes. (g) Representative image of IHC staining of DLAT and PD-L1 in HCC and paratumor normal tissues. Up: DLAT high, PD-L1 positive. Down: DLAT low, PD-L1 negative. Scale bar = 100 µm. (h) The correlation between DLAT and PD-L1 expression in 58 HCC patients. |
DLAT was highly expressed and associated with poor prognosis in HCC specimens
Since DLAT was highly expressed in HCCs and correlated with poor prognosis of patients in both the TCGA and ICGC cohorts (Supplementary Figures 1A, 1C, 2A, 2C, www.wjon.org), we firstly investigated the mRNA expression of DLAT in 36 paired HCC and paratumor tissues. The expression of DLAT mRNA was significantly higher in HCC tissues than that in paired paratumor tissues, as shown in Figure 6a. Moreover, immunohistochemical staining further confirmed the increased expression of DLAT in HCC samples in a large cohort comprising 120 patients (cohort 1), in which 66.67% of patients exhibited increased DLAT expression in HCC tissues compared with paired paratumor tissues (Fig. 6b, c). Subsequently, patients in cohort 1 were divided into high and low groups based on the median expression of DLAT to determine its prognostic value. As shown in Supplementary Table 1 (www.wjon.org), the expression of DLAT was correlated with several baseline characteristics including portal vein tumor thrombus (PVTT), Barcelona Clinic Liver Cancer (BCLC) stage and tumor, node, metastasis (TNM) stage. Univariate analysis showed that alpha fetoprotein (AFP), satellite, macroscopic vascular invasion (MVI), PVTT, single or multiple, TNM stage, Child-Pugh and DLAT were correlated with patient’s OS and DFS (Supplementary Tables 2 and 3, www.wjon.org). Based on multivariate Cox regression, high DLAT is independently associated with poor OS and RFS (Supplementary Tables 2 and 3, www.wjon.org). Kaplan-Meier survival analysis showed that patients with high expression of DLAT exhibited worse OS and RFS compared to patients with low expression of DLAT (Fig. 6d, e). Based on these findings, DLAT was significantly up-regulated in clinical HCC tissues and associated with poor outcome of patients.
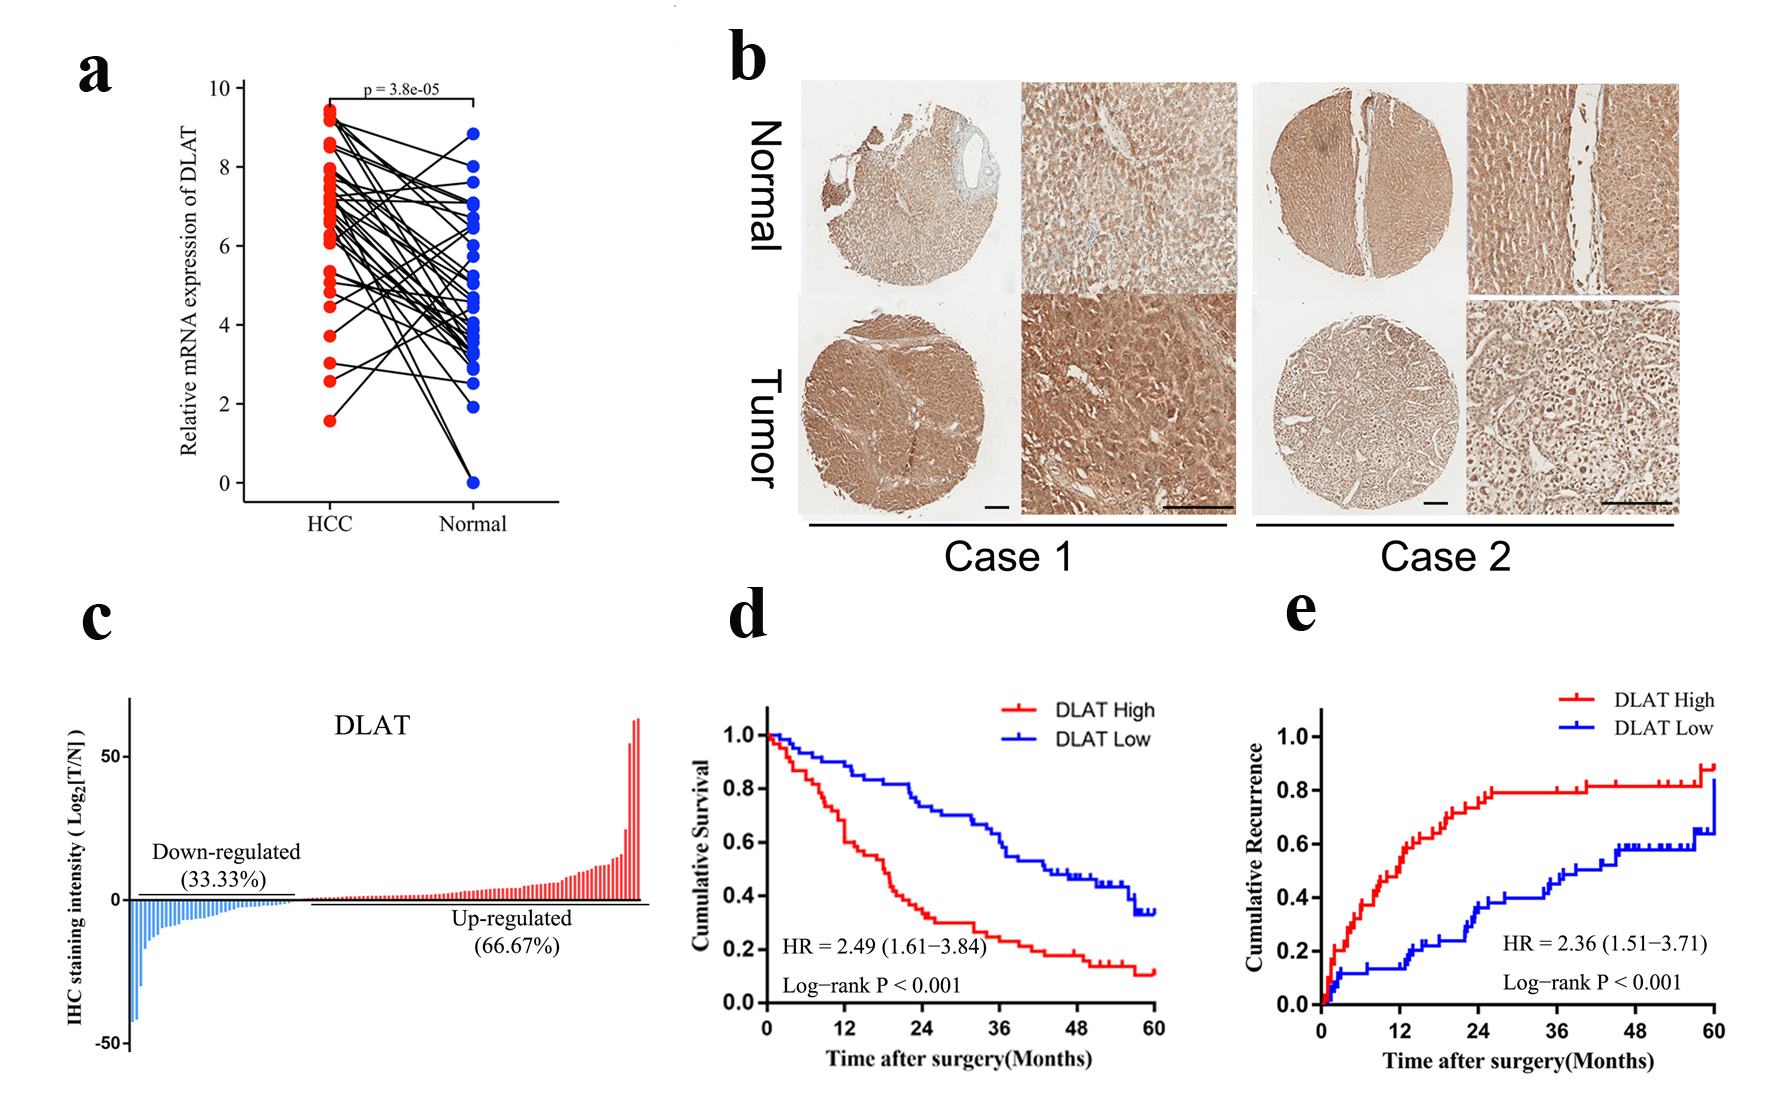 Click for large image | Figure 6. DLAT was highly expressed and associated with poor prognosis in HCC specimens. (a) mRNA expression of DLAT in 36 pairs of HCC and paratumor normal tissues were determined by real-time PCR. (b) Representative IHC staining of DLAT expression in cohort 1. Scale bar = 100 µm. (c) DLAT was up-regulated in the majority of HCC patients (66.67%). (d, e) OS (d) and RFS (e) of HCC patients after surgery were compared between the “high DLAT” and “low DLAT” groups using Kaplan-Meier analysis. |
| Discussion | ▴Top |
Unlike apoptosis, ferroptosis and necroptosis, cuproptosis is a new form of regulated cell death. Through direct binding of copper to lipoylated components of the TCA cycle, cuproptosis results in lipoylated protein aggregation and loss of iron-sulfur cluster proteins, leading to proteotoxic stress and ultimately cell death [12]. In the present study, we firstly explored the prognostic value of 10 CRGs in HCC and constructed a four CRGs signature by LASSO (Risk score = 0.520 × LIPT1 + 0.354 × DLAT + 0.084 × GLS + 0.196 × CDKN2A) using transcriptome data from TCGA database following validation in the ICGC database (Figs. 1-3). Moreover, functional analysis revealed cancer-related pathways, such as cell cycle, chemical carcinogenesis-DNA adducts, complement and coagulation cascades, glycine, serine and threonine metabolism and metabolism of xenobiotics by cytochrome P450 were enriched in both TCGA and ICGC cohort, which shows that our grouping has certain rationality and feasibility (Fig. 4). We further recruited a cohort of HCC patients and validated the expression and prognosis of DLAT. Immunohistochemical staining revealed that high DLAT was correlated with worse prognosis and higher expression level of PD-L1 in HCC patients (Figs. 5 and 6). According to our best knowledge, this is the first report about DLAT in HCC.
In tissues and serum of patients with cancers, such as lung cancer, breast cancer, gastric cancer, thyroid cancer, bladder cancer, oral cancer and prostate cancer, copper concentration is found higher than those in the healthy people [15-22]. Increasing evidences suggest that cuproptosis, a type of proteotoxic stress and non-apoptotic cell death induced by copper, is considered to regulate most steps of carcinogenesis and cancer progression, such as cell proliferation, cell death, tumor microenvironment, tumor cell spreading and drug resistance [23]. In the hepatocytes, overloading of copper disrupts the balance of lipid metabolism and the normal cell proliferation [24]. In HCC, Jin et al identified a cuproptosis-related miRNA signature for prognosis of HCC patients by silico technologies [25]. Zhang et al reported that a cuproptosis-related lncRNA signature can predict HCC patient prognosis and responsiveness to immune checkpoint blockade therapy, such as AC099329.2, AC138904.1, GIHCG and DNMBP-AS1 [26]. Subsequently, several researchers also constructed another set of cuproptosis-related lncRNA signature prognosis model for HCC patients, including MIR210HG, AC099850.3, AL031985.3, AC012073.1, MKLN1-AS, KDM4A-AS1, LINC01515, HCG15, MKLN1-AS, AL122035.1, and so on [27-29]. These findings indicated that cuproptosis-related noncoding RNAs might be involved in HCC via bioinformatics tools. However, the direct association between cuproptosis and HCC remains largely unknown. In this study, we constructed a CRGs signature model for predicting HCC patients’ prognosis.
CDKN2A, GLS, LIPT1 and DLAT were included in the four CRGs prognostic model of HCC in this study. CDKN2A, which encodes a cell cycle-related CDK, P16, contributes to a series of cellular functions, including cell proliferation, apoptosis, angiogenesis and chemotherapy resistance of cancer [30]. Several studies have shown that CDKN2A is linked to poor prognosis of gliomas [31], head and neck cancers [32], and pancreatic ductal carcinomas [33]. Similarly, another report has discussed the correlation between CDKN2A and immune infiltration of HCC [34]. The GLS enzyme, also called GLS1, catalyzes glutamine into glutamate and plays a key role in cancer cell metabolism, growth, proliferation, and treatment [35]. HCC patients with high GLS1 expression had longer survival time, indicating that GLS1 is an independent indicator [36]. It has been found that GLS1 enhances proliferation in HCC cells by activating AKT/GSK3β/CyclinD1 signaling [37], which may be reversed by NF-κB/p65 or miRNA-192/204 [38, 39]. Moreover, in HCC cell lines, targeting GLS1 inhibited stemness-related genes, and reduced CSC properties via ROS/Wnt/β-catenin signaling [40]. The lipoyltransferase 1, encoded by LIPT1, transfers lipoic acid from the H-protein of the glycine cleavage system to the E2 subunits of 2-ketoacid dehydrogenases [41]. It has been demonstrated that LIPT1 deficiency suppresses TCA cycle metabolism [42] and is associated with lipoylation defects and pulmonary hypertension [43]. Overexpression of LIPT1 in bladder cancer cell lines could, to some extent, weaken cell migration, whereas it has no influence on cell proliferation [44]. A study by Lv et al found that LIPT1 expression was decreased in melanoma and positively associated with PD-L1 expression, while negatively associated with Treg infiltration in immune microenvironment [13]. It is therefore possible that LIPT1 could be a good indicator of recovery for patients who receive immunotherapy for melanoma [13]. As part of the pyruvate dehydrogenase (PDH) complex, DLAT plays an important role in glucose metabolism and TCA cycle [12]. The study by Goh et al found that DLAT was up-regulated in gastric cancer cells, and that knockdown of DLAT with siRNA led to increased pyruvate levels [45]. However, the relevance and function of DLAT in cancers, such as HCC, is ambiguous. According to the constructed four CRGs prognostic model, we found that patients with high CRGs risk score showed reduced infiltration of CD8+ T cells, increased macrophages in the HCC tissues, and decreased OS.
We also explored the potential biological processes and signaling that implicated in the CRGs-based prognostic signature. Results showed that patients with high CRGs risk score exhibited decreased bile acid metabolism, decreased fatty acid metabolism, decreased adipogenesis, and favored glycolysis rather than oxidative phosphorylation. Inhibition of fatty acid synthesis impairs hepatocarcinogenesis in mice model and human cell lines [46, 47]. Farnesoid X receptor (FXR) is a major regulator involved in the control of bile acid synthesis. Ablation of FXR dramatically increases enterohepatic bile acid levels in disease progression from NAFLD to HCC [48], and FXR acts as a suppressor of HCC in mice model [49]. Many tumors used aerobic glycolysis to generate ATP even in the presence of oxygen to oxidate glucose into pyruvate [50]. Collectively, our data suggested that CRGs might participate in metabolism remodeling that facilitated liver cancer progression.
Finally, we confirmed that DLAT was higher in HCC than paratumor tissues and was correlated with unfavorable prognosis by immunohistochemistry in a 120 specimens tissue array. Moreover, DLAT could serve as an independent risk prognostic factor for OS and RFS of HCC patients. A negative correlation was also found between DLAT expression and CD8+ T cells, while a positive correlation was found with macrophages (Fig. 5b). Interestingly, previous findings showed that DLAT mediated metabolic changes impaired the activation of CD8+ T cells in multiple sclerosis [51], and DLAT was indispensable for mycobacterium to defense against macrophages [52]. The presence of DLAT was also correlated with the expression of PD-L1 (Fig. 5g, h), demonstrating its crucial role in the immune response against liver cancer.
In summary, we identified a novel prognostic model consisting of four CRGs that was independently associated with OS in TCGA and ICGC cohorts, providing insight into HCC prognosis prediction. In addition, DLAT was further confirmed to be up-regulated and correlated with poor survival of HCC patients in a clinical HCC cohort. However, this study also had some shortcomings. The first limitation is that we did not explore the detailed function of the four CRGs in HCC. Furthermore, it is unclear how CRGs, especially DLAT, interact with anti-tumor immunity in HCC. Cohort with HCC patients receiving PD-1/PD-L1 mAbs is therefore required to investigate the role of DLAT in immunotherapy of HCC in future.
| Supplementary Material | ▴Top |
Suppl Figure 1. (A) The relative mRNA expression of 4 CRGs (LIPT1, DLAT, CDKN2A and GLS) in HCC and normal liver tissues in the TCGA cohort. (B) Overall survival of HCC patients was compared between the ‘‘LIPT1 high’’ and “LIPT1 low” groups using Kaplan-Meier analysis in the TCGA cohort. (C) Overall survival of HCC patients was compared between the ‘‘DLAT high’’ and “DLAT low” groups using Kaplan-Meier analysis in the TCGA cohort. (D) Overall survival of HCC patients was compared between the ‘‘CDKN2A high’’ and “CDKN2A low” groups using Kaplan-Meier analysis in the TCGA cohort. (E) Overall survival of HCC patients was compared between the ‘‘GLS high’’ and “GLS low” groups using Kaplan-Meier analysis in the TCGA cohort.
Suppl Figure 2. (A) The relative mRNA expression of 4 CRGs (LIPT1, DLAT, CDKN2A and GLS) in HCC and normal liver tissues in the ICGC cohort. (B) Overall survival of HCC patients was compared between the ‘‘LIPT1 high’’ and “LIPT1 low” groups using Kaplan-Meier analysis in the ICGC cohort. (C) Overall survival of HCC patients was compared between the ‘‘DLAT high’’ and “DLAT low” groups using Kaplan-Meier analysis in the ICGC cohort. (D) Overall survival of HCC patients was compared between the ‘‘CDKN2A high’’ and “CDKN2A low” groups using Kaplan-Meier analysis in the ICGC cohort. (E) Overall survival of HCC patients was compared between the ‘‘GLS high’’ and “GLS low” groups using Kaplan-Meier analysis in the ICGC cohort.
Suppl Figure 3. (A, B) The most significant GO enrichment in the TCGA cohort. BP: biological process; CC: cellular component; MF: molecular function. The most significant GO enrichment in the ICGC cohort. BP: biological process; CC: cellular component; MF: molecular function.
Suppl Figure 4. Scatter plot showed the correlation of M0 macrophages (A) and CD8 T cells (B) in HCC with risk score. (C) Whole-section scanning for PD-L1 by immunohistochemical staining of HCC tissue microarray. The positive or negative staining in tumors were recorded. T: tumor, N: normal.
Suppl Table 1. Baseline Characteristics of Patients in Cohort 1.
Suppl Table 2. Univariate and Multivariate Analysis of OS of Patients in Cohort 1.
Suppl Table 3. Univariate and Multivariate Analysis of DFS of Patients in Cohort 1.
Acknowledgments
None to declare.
Financial Disclosure
This work was sponsored by Natural Science Foundation of Xinjiang Uygur Autonomous Region (2022D01C344).
Conflict of Interest
The authors declare that they have no conflict of interest.
Informed Consent
Not applicable.
Author Contributions
Acquisition of data: Wen Dong Bai, Jun Yu Liu, Miao Li, Xi Yang and Yu Lan Wang; analysis and interpretation of data: Wen Dong Bai, Jun Yu Liu and Miao Li; drafting of the manuscript: Jun Yu Liu, Wen Dong Bai and Miao Li; financial support: Shi Chao Li; critical revision of the manuscript: Shi Chao Li and Guang Jun Wang; study concept and design: Shi Chao Li and Guang Jun Wang.
Data Availability
All data that support the findings of this study are available to the corresponding authors by reasonable request.
Abbreviations
HCC: hepatocellular carcinoma; FDX1: ferredoxin 1; LIAS: lipoic acid synthetase; LIPT1: lipoyltransferase 1; DLD: dihydrolipoamide dehydrogenase; DLAT: dihydrolipoamide S-acetyltransferase; PDHA1: pyruvate dehydrogenase E1 subunit alpha 1; PDHB: pyruvate dehydrogenase E1 subunit beta; MTF1: metal regulatory transcription factor 1; GLS: glutaminase; CDKN2A: cyclin-dependent kinase inhibitor 2A; CRGs: cuproptosis-related genes; GO: gene ontology; KEGG: Kyoto Encyclopedia of Genes and Genomes; GSEA: gene set enrichment analysis; ssGSEA: single sample gene set enrichment analysis; TCGA: The Cancer Genome Atlas; ICGC: International Cancer Genome Consortium; PD-L1: program death ligand 1; DEGs: differentially expressed genes; RFS: recurrence-free survival; OS: overall survival; PVTT: portal vein tumor thrombus; BCLC: Barcelona Clinic Liver Cancer; TNM: tumor, node, metastasis; AFP: alpha fetoprotein; MVI: macroscopic vascular invasion; TCA: tricarboxylic acid
| References | ▴Top |
- Huang DQ, El-Serag HB, Loomba R. Global epidemiology of NAFLD-related HCC: trends, predictions, risk factors and prevention. Nat Rev Gastroenterol Hepatol. 2021;18(4):223-238.
doi pubmed - Yang JD, Hainaut P, Gores GJ, Amadou A, Plymoth A, Roberts LR. A global view of hepatocellular carcinoma: trends, risk, prevention and management. Nat Rev Gastroenterol Hepatol. 2019;16(10):589-604.
doi pubmed - Llovet JM, Kelley RK, Villanueva A, Singal AG, Pikarsky E, Roayaie S, Lencioni R, et al. Hepatocellular carcinoma. Nat Rev Dis Primers. 2021;7(1):6.
doi pubmed - Barcena-Varela M, Lujambio A. The endless sources of hepatocellular carcinoma heterogeneity. Cancers (Basel). 2021;13(11):2621.
doi pubmed - Jepsen P, West J. We need stronger evidence for (or against) hepatocellular carcinoma surveillance. J Hepatol. 2021;74(5):1234-1239.
doi pubmed - Huang A, Yang XR, Chung WY, Dennison AR, Zhou J. Targeted therapy for hepatocellular carcinoma. Signal Transduct Target Ther. 2020;5(1):146.
doi pubmed - Yang JD, Heimbach JK. New advances in the diagnosis and management of hepatocellular carcinoma. BMJ. 2020;371:m3544.
doi pubmed - Ge EJ, Bush AI, Casini A, Cobine PA, Cross JR, DeNicola GM, Dou QP, et al. Connecting copper and cancer: from transition metal signalling to metalloplasia. Nat Rev Cancer. 2022;22(2):102-113.
doi pubmed - Smolinski L, Litwin T, Redzia-Ogrodnik B, Dziezyc K, Kurkowska-Jastrzebska I, Czlonkowska A. Brain volume is related to neurological impairment and to copper overload in Wilson's disease. Neurol Sci. 2019;40(10):2089-2095.
doi pubmed - Fukai T, Ushio-Fukai M, Kaplan JH. Copper transporters and copper chaperones: roles in cardiovascular physiology and disease. Am J Physiol Cell Physiol. 2018;315(2):C186-C201.
doi pubmed - Lu CW, Lee YC, Kuo CS, Chiang CH, Chang HH, Huang KC. Association of serum levels of zinc, copper, and iron with risk of metabolic syndrome. Nutrients. 2021;13(2):548.
doi pubmed - Tsvetkov P, Coy S, Petrova B, Dreishpoon M, Verma A, Abdusamad M, Rossen J, et al. Copper induces cell death by targeting lipoylated TCA cycle proteins. Science. 2022;375(6586):1254-1261.
doi pubmed - Lv H, Liu X, Zeng X, Liu Y, Zhang C, Zhang Q, Xu J. Comprehensive analysis of cuproptosis-related genes in immune infiltration and prognosis in melanoma. Front Pharmacol. 2022;13:930041.
doi pubmed - Bian Z, Fan R, Xie L. A novel cuproptosis-related prognostic gene signature and validation of differential expression in clear cell renal cell carcinoma. Genes (Basel). 2022;13(5):851.
doi pubmed - Diez M, Cerdan FJ, Arroyo M, Balibrea JL. Use of the copper/zinc ratio in the diagnosis of lung cancer. Cancer. 1989;63(4):726-730.
doi - Jin Y, Zhang C, Xu H, Xue S, Wang Y, Hou Y, Kong Y, et al. Combined effects of serum trace metals and polymorphisms of CYP1A1 or GSTM1 on non-small cell lung cancer: a hospital based case-control study in China. Cancer Epidemiol. 2011;35(2):182-187.
doi pubmed - Adeoti ML, Oguntola AS, Akanni EO, Agodirin OS, Oyeyemi GM. Trace elements; copper, zinc and selenium, in breast cancer afflicted female patients in LAUTECH Osogbo, Nigeria. Indian J Cancer. 2015;52(1):106-109.
doi pubmed - Sohrabi M, Gholami A, Azar MH, Yaghoobi M, Shahi MM, Shirmardi S, Nikkhah M, et al. Trace element and heavy metal levels in colorectal cancer: comparison between cancerous and non-cancerous tissues. Biol Trace Elem Res. 2018;183(1):1-8.
doi pubmed - Khanna SS, Karjodkar FR. Circulating immune complexes and trace elements (Copper, Iron and Selenium) as markers in oral precancer and cancer : a randomised, controlled clinical trial. Head Face Med. 2006;2:33.
doi pubmed - Baltaci AK, Dundar TK, Aksoy F, Mogulkoc R. Changes in the serum levels of trace elements before and after the operation in thyroid cancer patients. Biol Trace Elem Res. 2017;175(1):57-64.
doi pubmed - Basu S, Singh MK, Singh TB, Bhartiya SK, Singh SP, Shukla VK. Heavy and trace metals in carcinoma of the gallbladder. World J Surg. 2013;37(11):2641-2646.
doi pubmed - Saleh SAK, Adly HM, Abdelkhaliq AA, Nassir AM. Serum levels of selenium, zinc, copper, manganese, and iron in prostate cancer patients. Curr Urol. 2020;14(1):44-49.
doi pubmed - da Silva DA, De Luca A, Squitti R, Rongioletti M, Rossi L, Machado CML, Cerchiaro G. Copper in tumors and the use of copper-based compounds in cancer treatment. J Inorg Biochem. 2022;226:111634.
doi pubmed - Huster D, Purnat TD, Burkhead JL, Ralle M, Fiehn O, Stuckert F, Olson NE, et al. High copper selectively alters lipid metabolism and cell cycle machinery in the mouse model of Wilson disease. J Biol Chem. 2007;282(11):8343-8355.
doi pubmed - Jin Z, Wang M, Meng Y, Chen D, Xu Y, Jiang X, Xiong Z. Prognostic Implication of a Cuproptosis-Related miRNA Signature in Hepatocellular Carcinoma. J Healthc Eng. 2022;2022:4694323.
doi pubmed - Zhang G, Sun J, Zhang X. A novel Cuproptosis-related LncRNA signature to predict prognosis in hepatocellular carcinoma. Sci Rep. 2022;12(1):11325.
doi pubmed - Luo L, Hu X, Huang A, Liu X, Wang L, Du T, Liu L, et al. A Noval Established Cuproptosis-Associated LncRNA Signature for Prognosis Prediction in Primary Hepatic Carcinoma. Evid Based Complement Alternat Med. 2022;2022:2075638.
doi pubmed - Chen S, Liu P, Zhao L, Han P, Liu J, Yang H, Li J. A novel cuproptosis-related prognostic lncRNA signature for predicting immune and drug therapy response in hepatocellular carcinoma. Front Immunol. 2022;13:954653.
doi pubmed - Zhang Q, Huang Y, Xia Y, Liu Y, Gan J. Cuproptosis-related lncRNAs predict the prognosis and immune response in hepatocellular carcinoma. Clin Exp Med. 2022.
doi - Jiao Y, Feng Y, Wang X. Regulation of tumor suppressor gene CDKN2A and encoded p16-INK4a protein by covalent modifications. Biochemistry (Mosc). 2018;83(11):1289-1298.
doi pubmed - Park JW, Kang J, Lim KY, Kim H, Kim SI, Won JK, Park CK, et al. The prognostic significance of p16 expression pattern in diffuse gliomas. J Pathol Transl Med. 2021;55(2):102-111.
doi pubmed - Bryant AK, Sojourner EJ, Vitzthum LK, Zakeri K, Shen H, Nguyen C, Murphy JD, et al. Prognostic role of p16 in Nonoropharyngeal head and neck cancer. J Natl Cancer Inst. 2018;110(12):1393-1399.
doi pubmed - Iwatate Y, Hoshino I, Ishige F, Itami M, Chiba S, Arimitsu H, Yanagibashi H, et al. Prognostic significance of p16 protein in pancreatic ductal adenocarcinoma. Mol Clin Oncol. 2020;13(1):83-91.
doi pubmed - Luo JP, Wang J, Huang JH. CDKN2A is a prognostic biomarker and correlated with immune infiltrates in hepatocellular carcinoma. Biosci Rep. 2021;41(10):BSR20211103.
doi pubmed - Yu W, Yang X, Zhang Q, Sun L, Yuan S, Xin Y. Targeting GLS1 to cancer therapy through glutamine metabolism. Clin Transl Oncol. 2021;23(11):2253-2268.
doi pubmed - Yu D, Shi X, Meng G, Chen J, Yan C, Jiang Y, Wei J, et al. Kidney-type glutaminase (GLS1) is a biomarker for pathologic diagnosis and prognosis of hepatocellular carcinoma. Oncotarget. 2015;6(10):7619-7631.
doi pubmed - Xi J, Sun Y, Zhang M, Fa Z, Wan Y, Min Z, Xu H, et al. GLS1 promotes proliferation in hepatocellular carcinoma cells via AKT/GSK3beta/CyclinD1 pathway. Exp Cell Res. 2019;381(1):1-9.
doi pubmed - Dong M, Miao L, Zhang F, Li S, Han J, Yu R, Qie S. Nuclear factor-kappaB p65 regulates glutaminase 1 expression in human hepatocellular carcinoma. Onco Targets Ther. 2018;11:3721-3729.
doi pubmed - Ge Y, Yan X, Jin Y, Yang X, Yu X, Zhou L, Han S, et al. MiRNA-192 [corrected] and miRNA-204 directly suppress lncRNA HOTTIP and interrupt GLS1-mediated glutaminolysis in hepatocellular carcinoma. PLoS Genet. 2015;11(12):e1005726.
doi pubmed - Li B, Cao Y, Meng G, Qian L, Xu T, Yan C, Luo O, et al. Targeting glutaminase 1 attenuates stemness properties in hepatocellular carcinoma by increasing reactive oxygen species and suppressing Wnt/beta-catenin pathway. EBioMedicine. 2019;39:239-254.
doi pubmed - Stowe RC, Sun Q, Elsea SH, Scaglia F. LIPT1 deficiency presenting as early infantile epileptic encephalopathy, Leigh disease, and secondary pyruvate dehydrogenase complex deficiency. Am J Med Genet A. 2018;176(5):1184-1189.
doi pubmed - Solmonson A, Faubert B, Gu W, Rao A, Cowdin MA, Menendez-Montes I, Kelekar S, et al. Compartmentalized metabolism supports midgestation mammalian development. Nature. 2022;604(7905):349-353.
doi pubmed - Tort F, Ferrer-Cortes X, Thio M, Navarro-Sastre A, Matalonga L, Quintana E, Bujan N, et al. Mutations in the lipoyltransferase LIPT1 gene cause a fatal disease associated with a specific lipoylation defect of the 2-ketoacid dehydrogenase complexes. Hum Mol Genet. 2014;23(7):1907-1915.
doi pubmed - Chen Y, Xu T, Xie F, Wang L, Liang Z, Li D, Liang Y, et al. Evaluating the biological functions of the prognostic genes identified by the Pathology Atlas in bladder cancer. Oncol Rep. 2021;45(1):191-201.
doi pubmed - Goh WQ, Ow GS, Kuznetsov VA, Chong S, Lim YP. DLAT subunit of the pyruvate dehydrogenase complex is upregulated in gastric cancer-implications in cancer therapy. Am J Transl Res. 2015;7(6):1140-1151.
- Li L, Pilo GM, Li X, Cigliano A, Latte G, Che L, Joseph C, et al. Inactivation of fatty acid synthase impairs hepatocarcinogenesis driven by AKT in mice and humans. J Hepatol. 2016;64(2):333-341.
doi pubmed - Lally JSV, Ghoshal S, DePeralta DK, Moaven O, Wei L, Masia R, Erstad DJ, et al. Inhibition of acetyl-CoA carboxylase by phosphorylation or the inhibitor ND-654 suppresses lipogenesis and hepatocellular carcinoma. Cell Metab. 2019;29(1):174-182.e175.
doi pubmed - Kettner NM, Voicu H, Finegold MJ, Coarfa C, Sreekumar A, Putluri N, Katchy CA, et al. Circadian homeostasis of liver metabolism suppresses hepatocarcinogenesis. Cancer Cell. 2016;30(6):909-924.
doi pubmed - Degirolamo C, Modica S, Vacca M, Di Tullio G, Morgano A, D'Orazio A, Kannisto K, et al. Prevention of spontaneous hepatocarcinogenesis in farnesoid X receptor-null mice by intestinal-specific farnesoid X receptor reactivation. Hepatology. 2015;61(1):161-170.
doi pubmed - Ganapathy-Kanniappan S. Molecular intricacies of aerobic glycolysis in cancer: current insights into the classic metabolic phenotype. Crit Rev Biochem Mol Biol. 2018;53(6):667-682.
doi pubmed - La Rocca C, Carbone F, De Rosa V, Colamatteo A, Galgani M, Perna F, Lanzillo R, et al. Immunometabolic profiling of T cells from patients with relapsing-remitting multiple sclerosis reveals an impairment in glycolysis and mitochondrial respiration. Metabolism. 2017;77:39-46.
doi pubmed - Shi S, Ehrt S. Dihydrolipoamide acyltransferase is critical for Mycobacterium tuberculosis pathogenesis. Infect Immun. 2006;74(1):56-63.
doi pubmed
This article is distributed under the terms of the Creative Commons Attribution Non-Commercial 4.0 International License, which permits unrestricted non-commercial use, distribution, and reproduction in any medium, provided the original work is properly cited.
World Journal of Oncology is published by Elmer Press Inc.